A couple of weeks ago I was back in the sunny Pilbara to help the Rangelands NRM and Greening Australia team run the first of a series of Conservation Action Planning workshops for the Pilbara Corridors project.
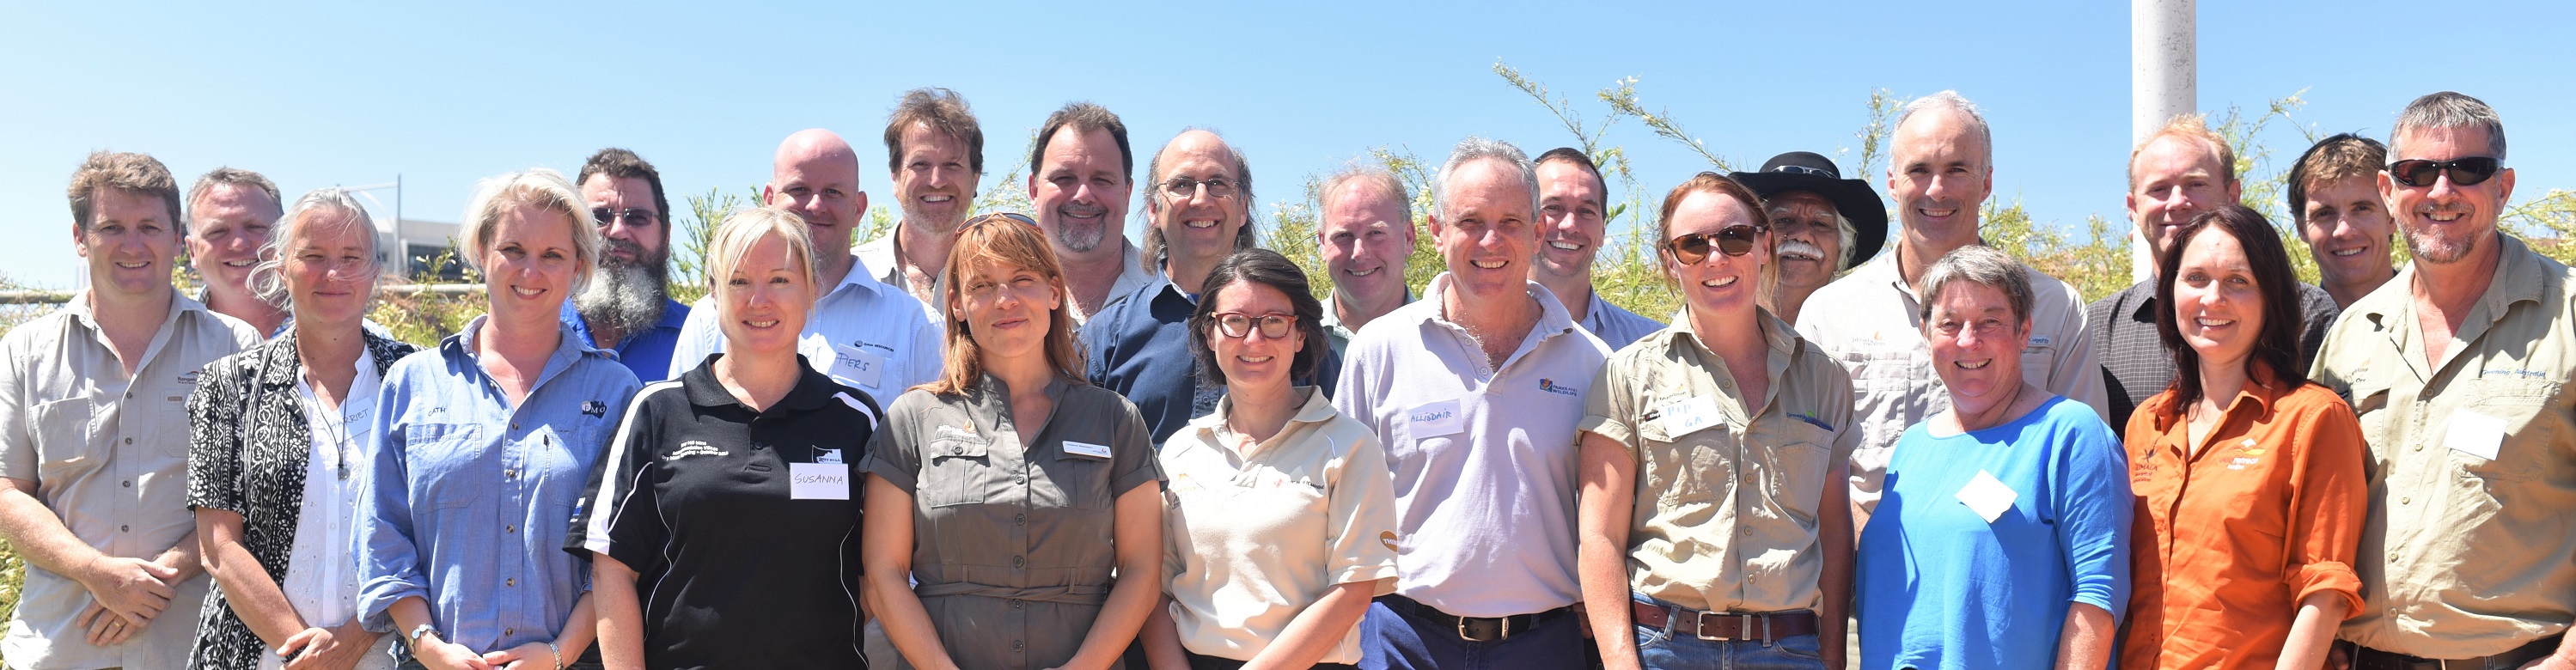 Attendees at the first Pilbara Corridors workshop in Karratha (photo courtesy Rangelands NRM)
Gaia Resources’ role at the workshop is very much about supporting the process in terms of spatial information, although with my background of working in the Pilbara I have had a fair amount of exposure to the area and to some of the amazing landscapes and challenges that it comes with.
For the purposes of the Pilbara Corridors workshops, we began by compiling information about where projects are being done in the Pilbara. This started with getting ‘brain dumps’ of what’s going on in the Pilbara from a range of people, and then turning that into points and polygons on a map. This isn’t an easy job in itself, but James, Grit and myself have been seeking out boundaries for projects (such as research trials, surveys, offset programs and other sorts of projects) and documenting them in the Rangelands NRM GRID https://www.gaiaresources.com.au/products/grid/ instance we have deployed for them.
Using GRID allows the Rangelands NRM team to add additional projects directly through their web browser. Being web based, GRID allows for anyone with access to be able to contribute data in the standardised format for that “Activity” (a term we use to define a ‘thing that you do’ – like fencing, weed control, etc).
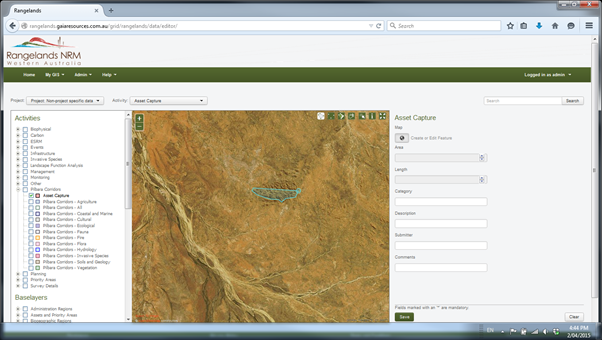 Using GRID to capture assets on the fly
Once these features are saved into GRID, they then become immediately visible in the complementary public web map that is in the Pilbara Corridors web site. We do this through the WordPress plugin we have developed that complements GRID, and is in use by both Rangelands NRM and the South West Catchment Council in their public facing web sites. You can see the web map by clicking here or on the image below – have a look around and if you can think of projects we’ve not included, then contact the team at Pilbara Corridors .
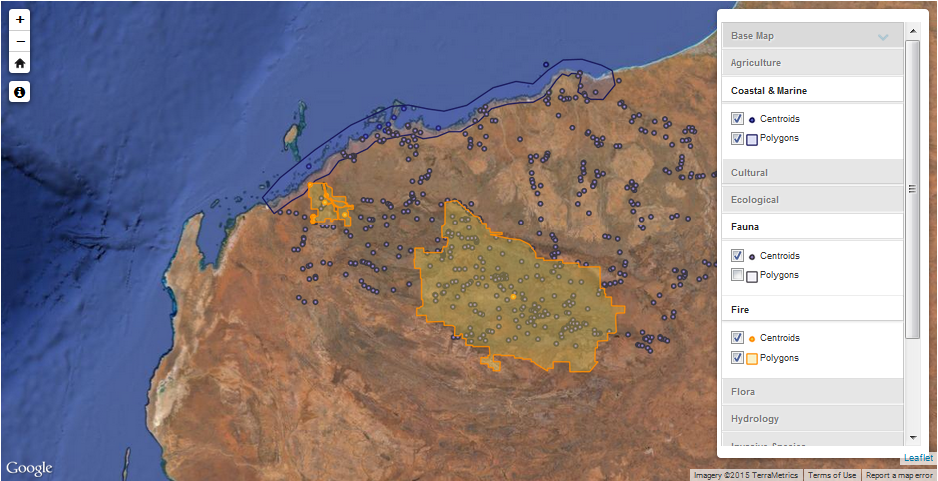 The projects map for Pilbara Corridors
Any data in GRID, be it “Activity” or “base layer” data, can be exposed through this method to allow for use in public web sites (of course, you have to be aware of the licencing for your data and not allow data that you shouldn’t make available to appear to the public!). Together, GRID and the web map provide a pretty powerful combination for public engagement, and it was this combination I used through the Karratha workshop for the Pilbara Corridors project.
Firstly, we had already gathered all the project data into GRID, as both polygon extents, and, because it’s hard to visualise so many polygons effectively, as a series of points created from their centroids. In addition, we created a heatmap that showed the density of projects in the Pilbara, which is a powerful way of visualising such complex data.
 How well studied is the Pilbara?
The first workshop really aimed to capture information about the scope of the project, the types of assets to be considered and the vision for the Pilbara from the participants. As a result, we have a listing of many different types of “asset” that the Pilbara has, and why these are actually “assets”. Some of the assets that emerged included concepts like “groundwater”, specific places like the Fortescue Marsh and cultural assets like the Burrup Penninsula and specific waterholes.
During the day I was able to use GRID (with some hiccups caused by the lack of wifi, and switching out to run it through my phone) to demonstrate where the “assets” were that people really wanted to see. In some cases, I was able to use a satellite imagery layer as a contextual layer for many of the discussions we had, just to illustrate where things are. During the discussion about the definition of “the Pilbara” I was able to overlay Local Government Areas, the IBRA Bioregion and hydrological catchments to look at how you actually define the Pilbara, an interesting discussion in itself.
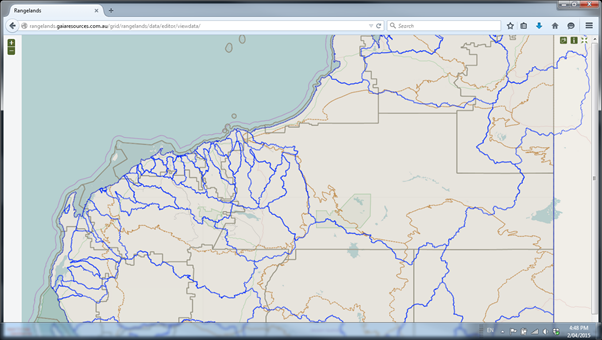 Choose your own Pilbara – LGAs (grey), catchments (blue) and IBRA regions (brown)
The first workshop captured a lot of these assets and concepts from the broad range of people involved – the next challenge is to start mapping and preparing this data for use in the second workshop. I’ll be using GRID again, but since we’ll also be doing some analysis, I’ll supplement this by also using QGIS. QGIS has, over the last few years, become my go-to GIS package, especially so with the recent 2.8 release (we’re also now running training in it).
As the Director, sometimes I like to get back out and get my hands dirty, so to speak. So using the tools we have developed (even if just for a day) to help support our clients is certainly a way of doing that. I’m looking forward to heading back up to the Pilbara in early May to get just a touch of red dirt under my skin again!
Piers
Feel free to leave a comment below, or follow up with us via Facebook, Twitter or LinkedIn.
Well done Piers. Having the increasing collation of survey and project work being undertaken is creating a good footing on which to take important next steps
Thanks Chris! I’m just writing up a blog about Workshop Two, as well.