Last week the team here at Gaia Resources (led by Serge) released a new web update for the Medical Entomology component of the Atlas of Environmental Health, with a range of new features and tweaks included in it. In the next couple of days the associated mobile apps will also receive an update to round out the update process. This round of updates was funded from the Department of Health and Human Services, Victoria, after our work last year in bringing Victoria on board with the project, although we have also had representation from the Department of Health (WA) throughout these updates to ensure that the updates work in both Western Australia and Victoria.
We thought that this is an opportune time to release a blog about the updates – Tracey and Chris have also been updating the user manual with all these changes as well, so you can see the details in that online resource.
Streamlining Monitoring
There has been quite a bit of work in the recent updates on the Monitoring component of the Medical Entomology module. Firstly, there are a range of workflow modifications on the Adult and Larval Monitoring forms to bring them to a more consistent look and feel, which has been something that has bugged a few of us involved in the project (that have some OCD tendencies). This has mainly been cosmetic, but it certainly means that the system feels a lot more consistent.
One of the new functionality changes is the addition of “Spot Treatment” on the Larval Monitoring forms (see below), which is the first of the treatment components we are releasing (see Chris’ previous blog about further research into treatment areas we ran with the City of Bayswater).

The new Spot Treatment form
The Spot Treatment form simply allows you to record the treatment you might do at the end of a larval monitoring session – i.e. when you have finished dipping at a site, and then decide to immediately treat the site by applying some chemical. This was an important thing to add, because what this does is allow us to place a specific line showing treatment on the Larval Monitoring reports – so you can start to see the efficacy of the treatment at a site, like in the sample graph we used in testing below – the abundance of larvae drops, and you can see the bright red line indicating this is because of a treatment.
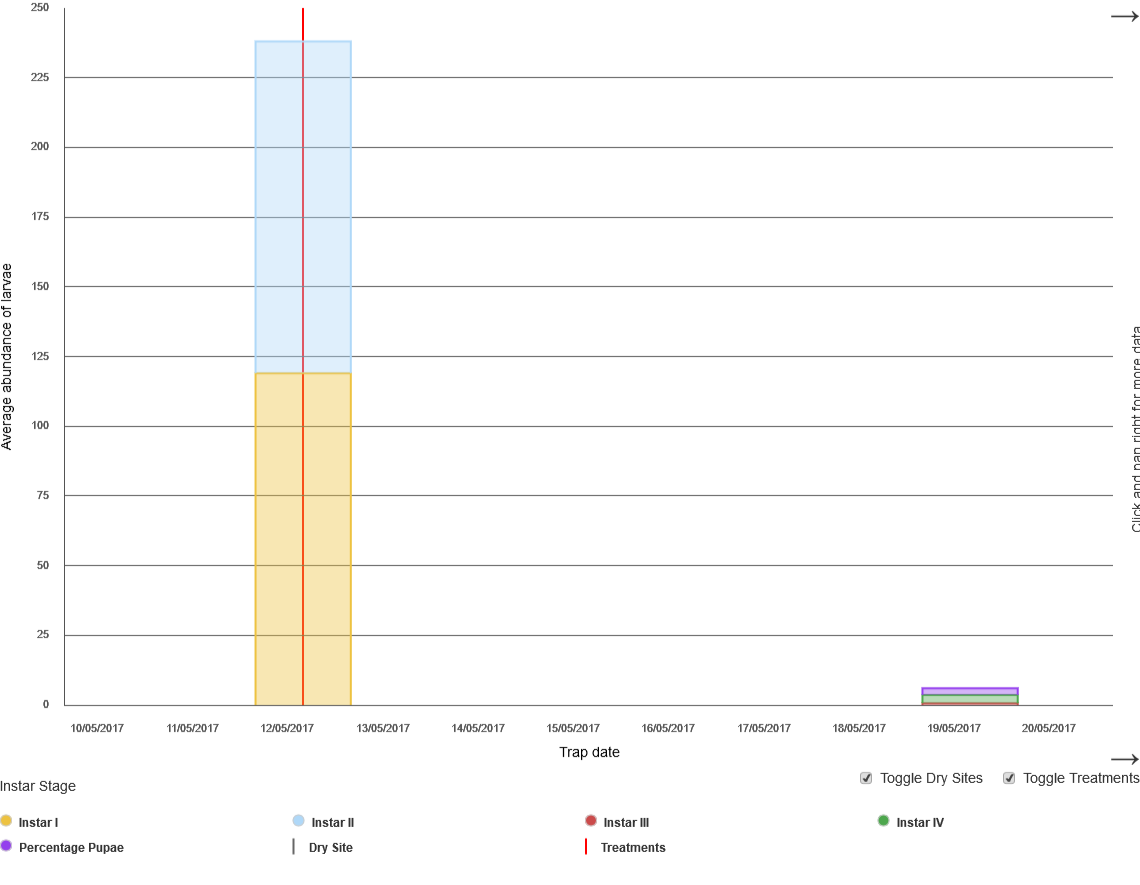
An example chart showing mosquito larvae dropping off after treatment
There has also been a new function added to both monitoring components, namely the integration with the Bureau of Meteorology weather services.
If your site is within a 50km radius of a Bureau of Meteorology weather station, and the date and time on your observation is within the last 72 hours, then we match up to the nearest station and bring across a set of environmental variables from the weather station automatically, and the closest record in terms of time to your observation. These five fields (air temperature, humidity, cloud cover, wind direction and wind speed) are sourced from the weather station live feed, and are then transformed into the units that we use in the Atlas (e.g. converting wind speed from knots to a category value). This all happens behind the scenes – and even from the mobile apps, which do this populating process when the records arrive at the server after a mobile synchronisation.

The new Bureau of Meteorology weather integration fields
Of course, you can also populate these fields yourself from the field in your own set of forms – as we know that microclimate at the local site might well be quite different from a weather station 50 kilometers away!
Additional Reporting
One of the ‘missing’ components of the Medical Entomology workflow was the Larval Reporting, and that’s been upgraded in this latest release to match the types of reports we also provide for the Adult trapping data, namely:
- Charting site abundance – seeing the total numbers of larvae over time for a site,
- Instar chart site abundance – seeing the breakdown of the various instar percentages over time at a site (as shown above), and
- Abundance map – showing the abundance of larvae on a mapping background.
The interesting one here was the mapping one – in the Adult report we can make a series of pie charts that are coloured by species, but we can’t do the same for larvae. So in this mapping component, we simply produce a series of different sized circles according to the abundance of larvae, like the map below (using a variety of real and test data for the Victoria).
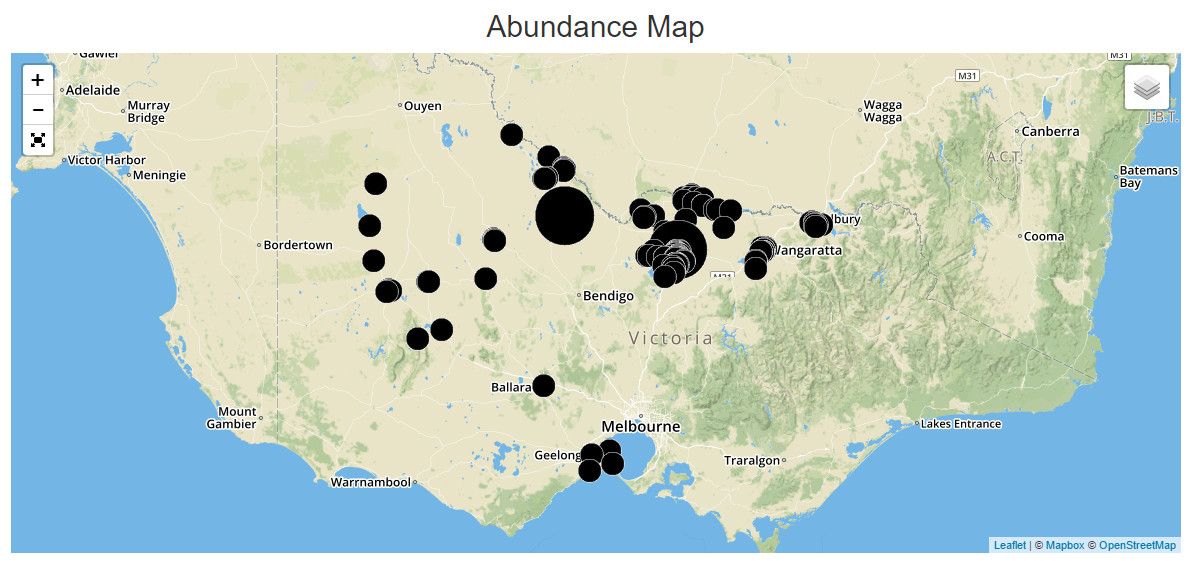
An example abundance map for larvae
There’s also been a lot of behind-the-scenes work on the graphing components across the board on the graphing and charting components of this component of the system, which has all come about because of the heavy use of the system by our new Victorian counterparts – the amounts of data coming in from them has really given us an impetus to make a range of additional upgrades and changes to the system to account for the new volumes (and high frequency!) of data coming in.
Existing users will also note a couple of additional reporting changes, including the addition of filters on the Review Records screen, and a brand new Export Data function that allows users to export all of their data from the system. We really feel that these two additional functions are great ways to get more productivity into the Atlas, and both flow on from feedback we’ve had from people using the system.
Chemical stock
One of the new requirements we met within Victoria was around managing chemical stocks, as the Department of Health and Human Services provides all the chemical stock to the local governments for treatment, and sometimes needs to know where to get hold of stock for emergency applications or treatments. So the basic chemical stock management component was introduced to the system in this update.

The simple stock management functionality
In essence, this chemical stock management system is simple and easy to use, and it is the stub for future work on treatments. Our plans for the future around treatments are to link up the ability to document a treatment event in the system to the stock management – so when a treatment occurs, the stock levels automatically adjust to indicate these chemicals have been used. While that’s not yet implemented in the system (e.g. the spot treatment component just has two fields for recording chemicals used, but doesn’t yet link to stock management), it’s a great starting point for a future upgrade.
Collaboration and teams
The final point I wanted to raise was the importance of collaboration throughout this last round of updates.
This round of updates was funded from the Department of Health and Human Services (Victoria), and here at Gaia Resources we have also put in additional resources to ensure that a range of things that we feel are important have been added to the system, so we’ve also funded it in that sense. That’s not unusual for us – we do feel that many of our projects really are about creating long-lasting partnerships rather than doing simple one-off projects, and we put our time (and money) into these partnerships in a very real sense. Despite not having ‘skin in the game’ as it were, we still had all of the planning and demonstration meetings open to the WA Department of Health, as they were a previous funder of the system. This was a big part of how good the end result is – getting the main stakeholders in the room has been a key part of the success of these new functions. So, having Rebecca Feldman (DHHS), Dr. Peter Neville (DoH) and myself in the room as the three ‘clients’ has been a key part in delivering a great outcome for the project.
This has been a big team approach overall for this round of updates. On the technical side, Serge, James P and Rob have done wonders on the system to make it jump through all the hoops we have needed it to. Chris has kept us all on track from the project management point of view, and along with Tracey and myself have updating the user manuals and doing a bunch of testing. Others in our team – like Shay – have also been brought in to help with particular tasks, like getting the cloud infrastructure tuned for performance. So it’s been a massive team effort that I’m really proud to have been involved with, and I’m really happy with the result.
For more information on the Atlas, feel free to contact either Chris or myself in our Perth office on (08) 92277309 – or as always, you can start a conversation with us via social media on Facebook, Twitter or LinkedIn.
Piers
Comments are closed.