If you’ve come across the term “linear corridor assessment,” it most likely conjures up images of highways, pipelines or major infrastructure projects. What about wildlife corridors and ecosystem connectivity? Linear corridor assessment refers to the analysis and planning conducted to identify optimal routes for connectivity or transport of a valued asset – whether it be natural gas, electricity, people or native fauna.

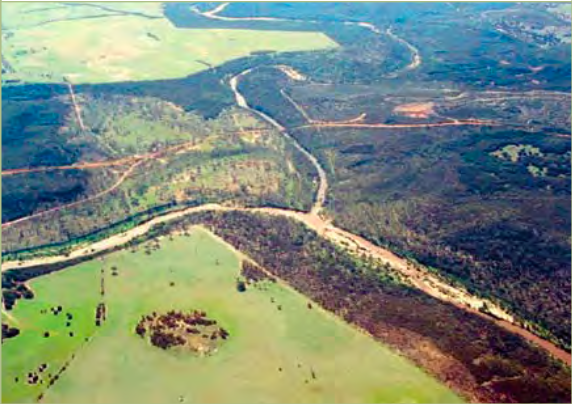
A wildlife corridor as an overpass across a major highway in Banff, Alberta (top), and ecosystem corridors alongside farmland in the South Coast of Western Australia (bottom).
Recently we’ve had some fun turning linear corridor assessment methods towards conservation applications. The Great Victoria Desert Biodiversity Trust (GVDBT) have embarked on an ambitious survey that will leverage hundreds of kilometres of LIght Detection and Ranging (LIDAR) data to detect mounds and assess habitat for the endangered Malleefowl (building on our previous work). We’ve been helping them to design a LIDAR survey corridor that will give them best value for money based on satellite imagery, vegetation data, accessibility constraints and previous mound sightings.
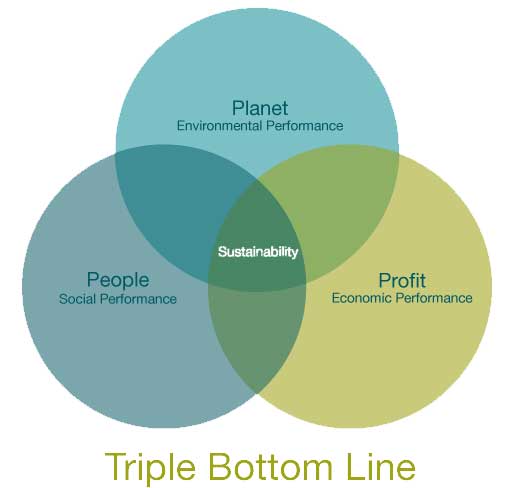
In traditional use of linear corridor assessment, engineers aim to identify the most (cost) efficient infrastructure route between A and B, and consider a range of constraints early in a project life-cycle to map out options for these corridors. Cost efficiency is more than just considering the financial components – like construction labour and materials cost multiplied by distance; limiting (negative) environmental and social impacts can represent just as much value to an organisation’s bottom line. While the term triple bottom line (economic, social and environment) is no longer a catch phrase in business, for many years organisation’s have relied on these concepts to understand the full impacts and sustainability of planning decisions. It is at the root of the linear corridor assessment process. The assessment process normally involves more than just engineers too – it requires stakeholder input from subject matter experts in environment, heritage and sustainability, and is largely driven by the Spatial Scientist.
Linear corridor assessment uses a Multi-Criteria Analysis approach within Geographic Information Systems (GIS) software, and is a particularly interesting project to the spatial scientist (or at least to this one). When I’ve been involved in these projects, I’ve gained a lot of satisfaction from seeing the power of data, geography, numerical modelling, stakeholder engagement, options analysis and negotiation coming together to demonstrate business value and limit our environmental footprint. The spatial scientist plays a pivotal role in being able to turn group thinking and preferences into tangible options based on solid analysis techniques, and help stakeholders visualise the results through rich map products.
So how does it work? The short explanation:
- It usually begins with a criteria workshop. A group of stakeholders are brought together to identify and agree on the key factors that are favourable to, are a constraint, or are a ‘No-go’ for the asset.
- The spatial scientist sources various datasets that can represent each of the criteria, processes them in GIS software into grid-based criteria mapping layers (e.g. rasters), and shares overview maps with stakeholders. Rankings are also assigned within a particular criterion, where stakeholders want to use a classification (e.g. wetland conservation class) to categories with a range of scores, or where values can be naturally grouped into classes (e.g. slope ranges).
- The criteria layer values are normalised to prevent bias and over-representation.
- A second workshop for criteria weighting is held to get consensus amongst stakeholders on the relative importance of each criteria. The results are tabulated in a weighted criteria table – the more important a criteria the higher the weighting.
- The weightings are applied to the criteria mapping layers, such that each gridded cell holds a value representing an initial score multiplied by the criteria weight.
- Algebra is used to add up all the weighted scores for each gridded cell, to create a suitability index.

A graphical example of two raster datasets whose cell values are added together using map algebra.
7. From there a path-distance toolset is run to create one or more corridor options between a desired source and destination. These represent least-cost paths; in other words, lines that have been calculated to have the lowest aggregate scores.
Often a review of the options can get a lot of debate going and result in a re-assessment of criteria weightings, which means running the path-distance tools again. A relaxing of a constraint here, or increasing the importance of a favourable condition there. Perhaps the introduction of a new criterion not considered before. The linear corridor assessment process can be quite simple or highly iterative and complex, depending on the number of constraints and the make-up of the stakeholder group.
Digital transformation and the Internet of Things brings new and exciting data sources to the table for the spatial scientist to consider – either to increase the coverage and accuracy of an existing criterion, or to add a new element to the study that was not previously possible. Sensor based data from mobile phones (like vehicle, cycle and people movement), rooftop solar installations and weather sensors, and a range of monitoring devices can provide a more informative and time-sensitive picture of what is going on in our world. This all plays nicely into the hands of the spatial scientist who is in that project team looking or suitable datasets to conduct analyses like linear corridor assessment.
I’d love to hear your feedback on this topic and to hear how other companies use these types of techniques, so feel free to contact me, or start a chat with us via Facebook, Twitter or LinkedIn.
Chris
Comments are closed.