And the answer is: Software that actually works in the field.
Earlier this month, Benny and I attended a field exercise down in Brookfield Conservation Park, just outside of Adelaide. The aim of the exercise was to put into practice some of the methods being developed by TERN AusPlots for performing ecological surveys of rangelands, and to finesse the field data collection tools that we’re building as part of the Atlas of Living Australia’s citizen science project to support these methodologies.
After several false starts due to #Ashpocalypse2011, we armed ourselves with a surge protector (for the generator), a wifi access point and a bunch of laptops and android tablets, and jumped into a little rental Yaris (carbon offset of course) at Adelaide airport to head bush.
During the first day, we spent most of our time observing and later participating in point stepping, a process which involves surveying the surface substrate and vegetation at approximately 1000 points within a 100 by 100 metre plot. Each point in the plot requires at least 1 record, and when there are several species of vegetation the process may require four or five records to be made per point. You don’t need to be a mathematician to realize that there’s a lot of data to be recorded here and we came to the realisation that our tools, which were originally designed for the citizen science use case weren’t designed with such high volume traffic to go through them. We made several other discoveries about our tool during this session, and we noted down in as much detail as we could what we needed to fix or change.

Loading a new build of the mobile tool on a Samsung Galaxy Tab.
Our next step was a whiteboard session to figure out how we could support the kind of rapid data entry that we were seeing in the point intersect survey. After fleshing out a rough design and running this by some of the AusPlots folk, Benny set to work on the new data entry screen. Integral to the design were a number of adaptive quick link keys that add records based upon the species most seen during the survey and as much prepopulation of data as possible. With the new design we anticipated being able to reduce the number of clicks per point from around a dozen to just three or four.
The next day, I was able to take an early version of the new data entry screen out onto one of the test plots and start to give it a go. The difference was pretty remarkable, and I was almost able to keep up with the rate of data collection. A few more tweaks, and we were really getting somewhere. The rest of that afternoon was dedicated to getting these tweaks in.
On the final day of testing, we put the tool into the hands of the people who will actually be using it. At first it took a little while to get used to the software, but after only a few points along a transect, the data entry started to become smooth and rapid. Interestingly, there was no clear winner between the tablet and the mobile phone in terms of end-user preference. Some people preferred the phone, others the tablet.
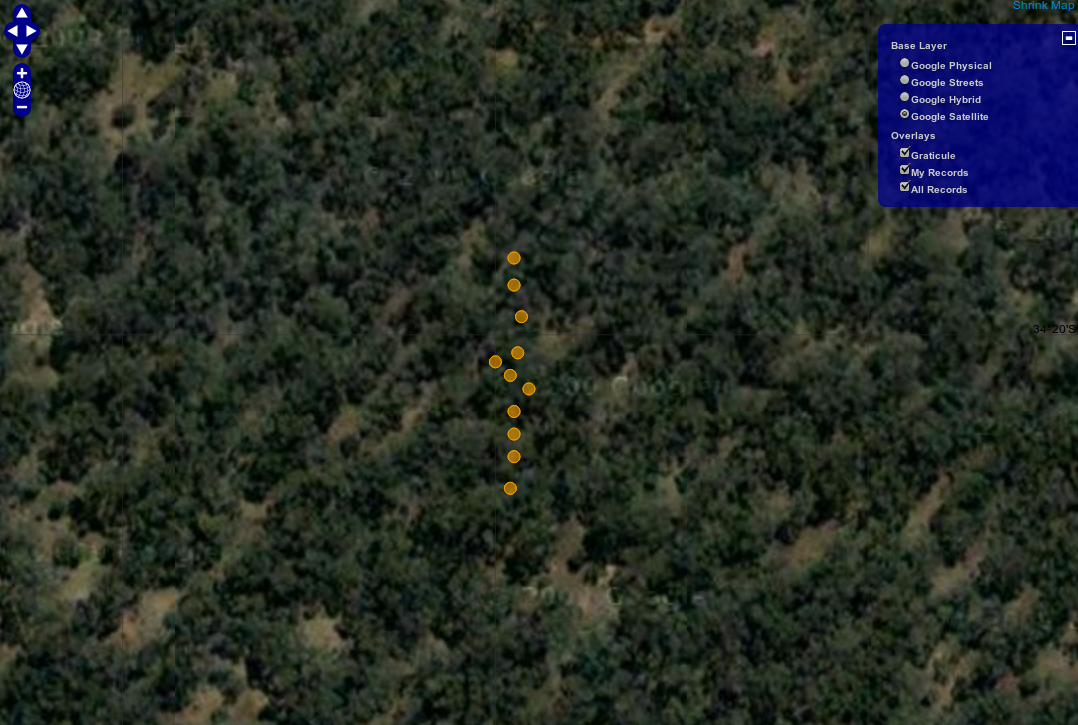
Data collected along a transect, as these are clustered points, there’s actually a lot more than appears (see below).
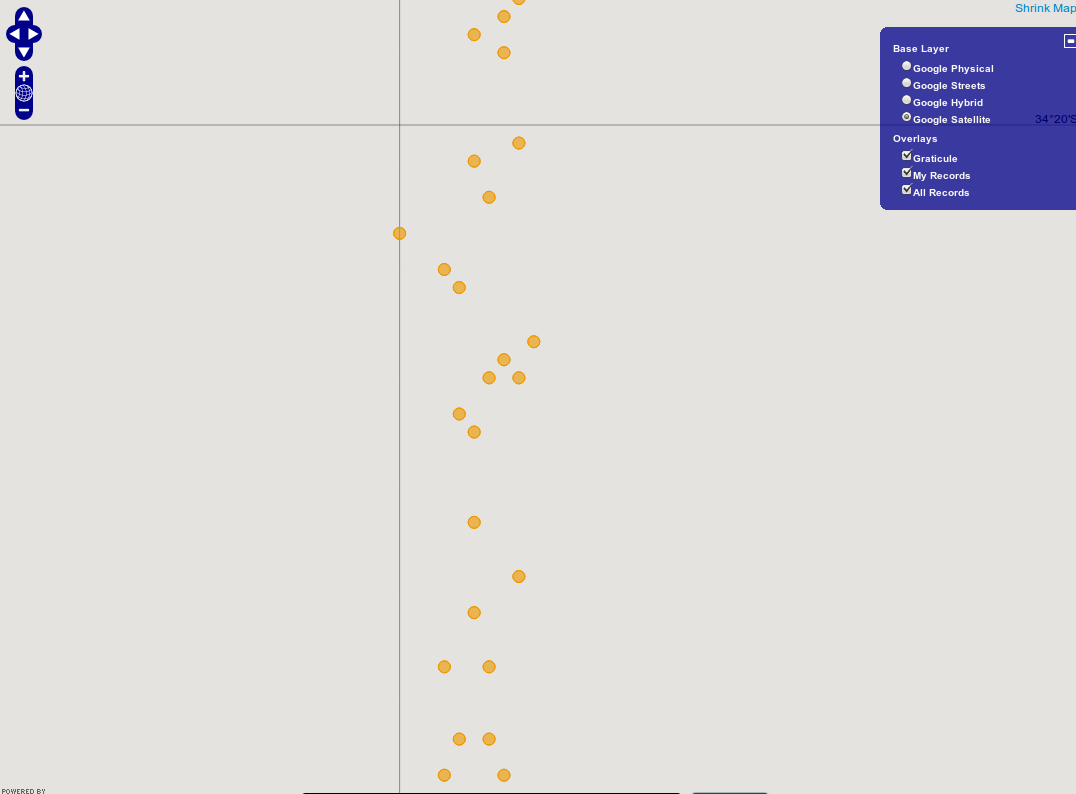
Zoomed in points along a transect, note the GPS drift, as these points were in a straight line.
It was a pretty full-on few days out in the field, but it was thoroughly enjoyable and the software is definitely in better shape for it. The real benefit of going into the field to work on this project was to get a really good understanding of how people do business, and what they need our software to do for them. If any of the TERN guys read this, thanks for making the trip an enjoyable and memorable one.
So here’s a list in no particular order of what we learnt from this exercise:
- Consumer grade tablet PC’s really need to be put into a good case to protect them from dust and water. We didn’t destroy any on this trip, but it would only be a matter of time…
- Interfaces need to be fast. This can be achieved through smarter workflows, quick link buttons and prepopulating as much data as possible.
- Software that learns from the data that is being entered can adapt to really improve the speed of data entry.
- The GPS in these devices is not accurate enough for the point intersect kind of survey, but more than adequate for general sightings and other survey types.
- The consumer grade devices (Samsung Galaxy Tab, HTC Desire) we tested absolutely require a means of charging them whilst on site. Running the GPS non stop, and working the devices hard really takes it’s toll on battery life – we were seeing a maximum of around 5 hours runtime, and sometimes even less.
- There’s a big difference in performance between devices, even with similar specifications. The HTC Desire we were using seemed to be much faster than the Galaxy Tab. On the other hand, the Galaxy tab’s larger screen made data entry easier.
- Wifi hotspots can be very inconsistent. Our little 802.11g hotspot was so bad that we ended up using the ‘wireless hotspot’ feature of one of the Galaxy Tabs to provide our wireless networking.
- Even if the data collection is marginally slower capturing it in digital form, there is a massive saving of time over entering it into a database from field sheets later.
- Statistics being generated on the device as the field data is being collected can be really useful for capturing trends or patterns of what’s going on in the environment.
AJ
Comments are closed.