There have been changes to the regulations around disturbance mapping in Western Australia since the introduction of the Mining Rehabilitation Fund Act 2012. Gaia Resources has been doing disturbance mapping for a number of years for clients, and we’re now at the pointy end of these changes, so we thought it time to provide an update.
Under the Mining Rehabilitation Fund (MRF), proponents need to report disturbance figures by the 30th June 2014.
Previously the end of June dates were when imagery was acquired for the Annual Environmental Reporting cycle, with a September date for lodging the report with disturbance mapping data within it.
With the introduction of the MRF, it is now compulsory to register, and then report on disturbance before 30th June 2014. In doing this you need to have registered with the MRF already, and have your 2012-13 and your 2013-14 disturbance data ready to put into the new MRF reporting system.
As part of the MRF introduction, DMP have also changed their disturbance categories from previous years. For example, we used to classify pipelines according to the amount of Total Dissolved Solids, and there were two bond rates for these pipelines. Now, all pipelines are bundled into transport or service infrastructure corridors, which include roads (access and haulage), causeways, rail, pipelines and power lines, making classification a little bit simpler.
 Changes for the transport or service infrastructure corridors disturbance type reduce the categories significantly
However, there are some complications in these changes. As another example, previously Fuel Storage Facilities were not a separate category, but now they are. So there are going to be some groups who have their fuel storage facilities under Workshops or Plant facilities, and will need to separate them out in the future. Thankfully it seems that since these all have the same unit rate for the calculations, you might not need to rework historical data. But if you have a fuel storage facility away from these areas, there will be some reworking to do of your historical 2012-13 data.
To get ready for the MRF ‘season’, we have been working with Geoimage, whose Perth team are now residing with us in our offices in Leederville. Geoimage are an independent Satellite Imagery and Geospatial Solutions provider, and they don’t just sell images – they provide professional advice on the supply and application of commercially available satellite imagery and spatial datasets and services.
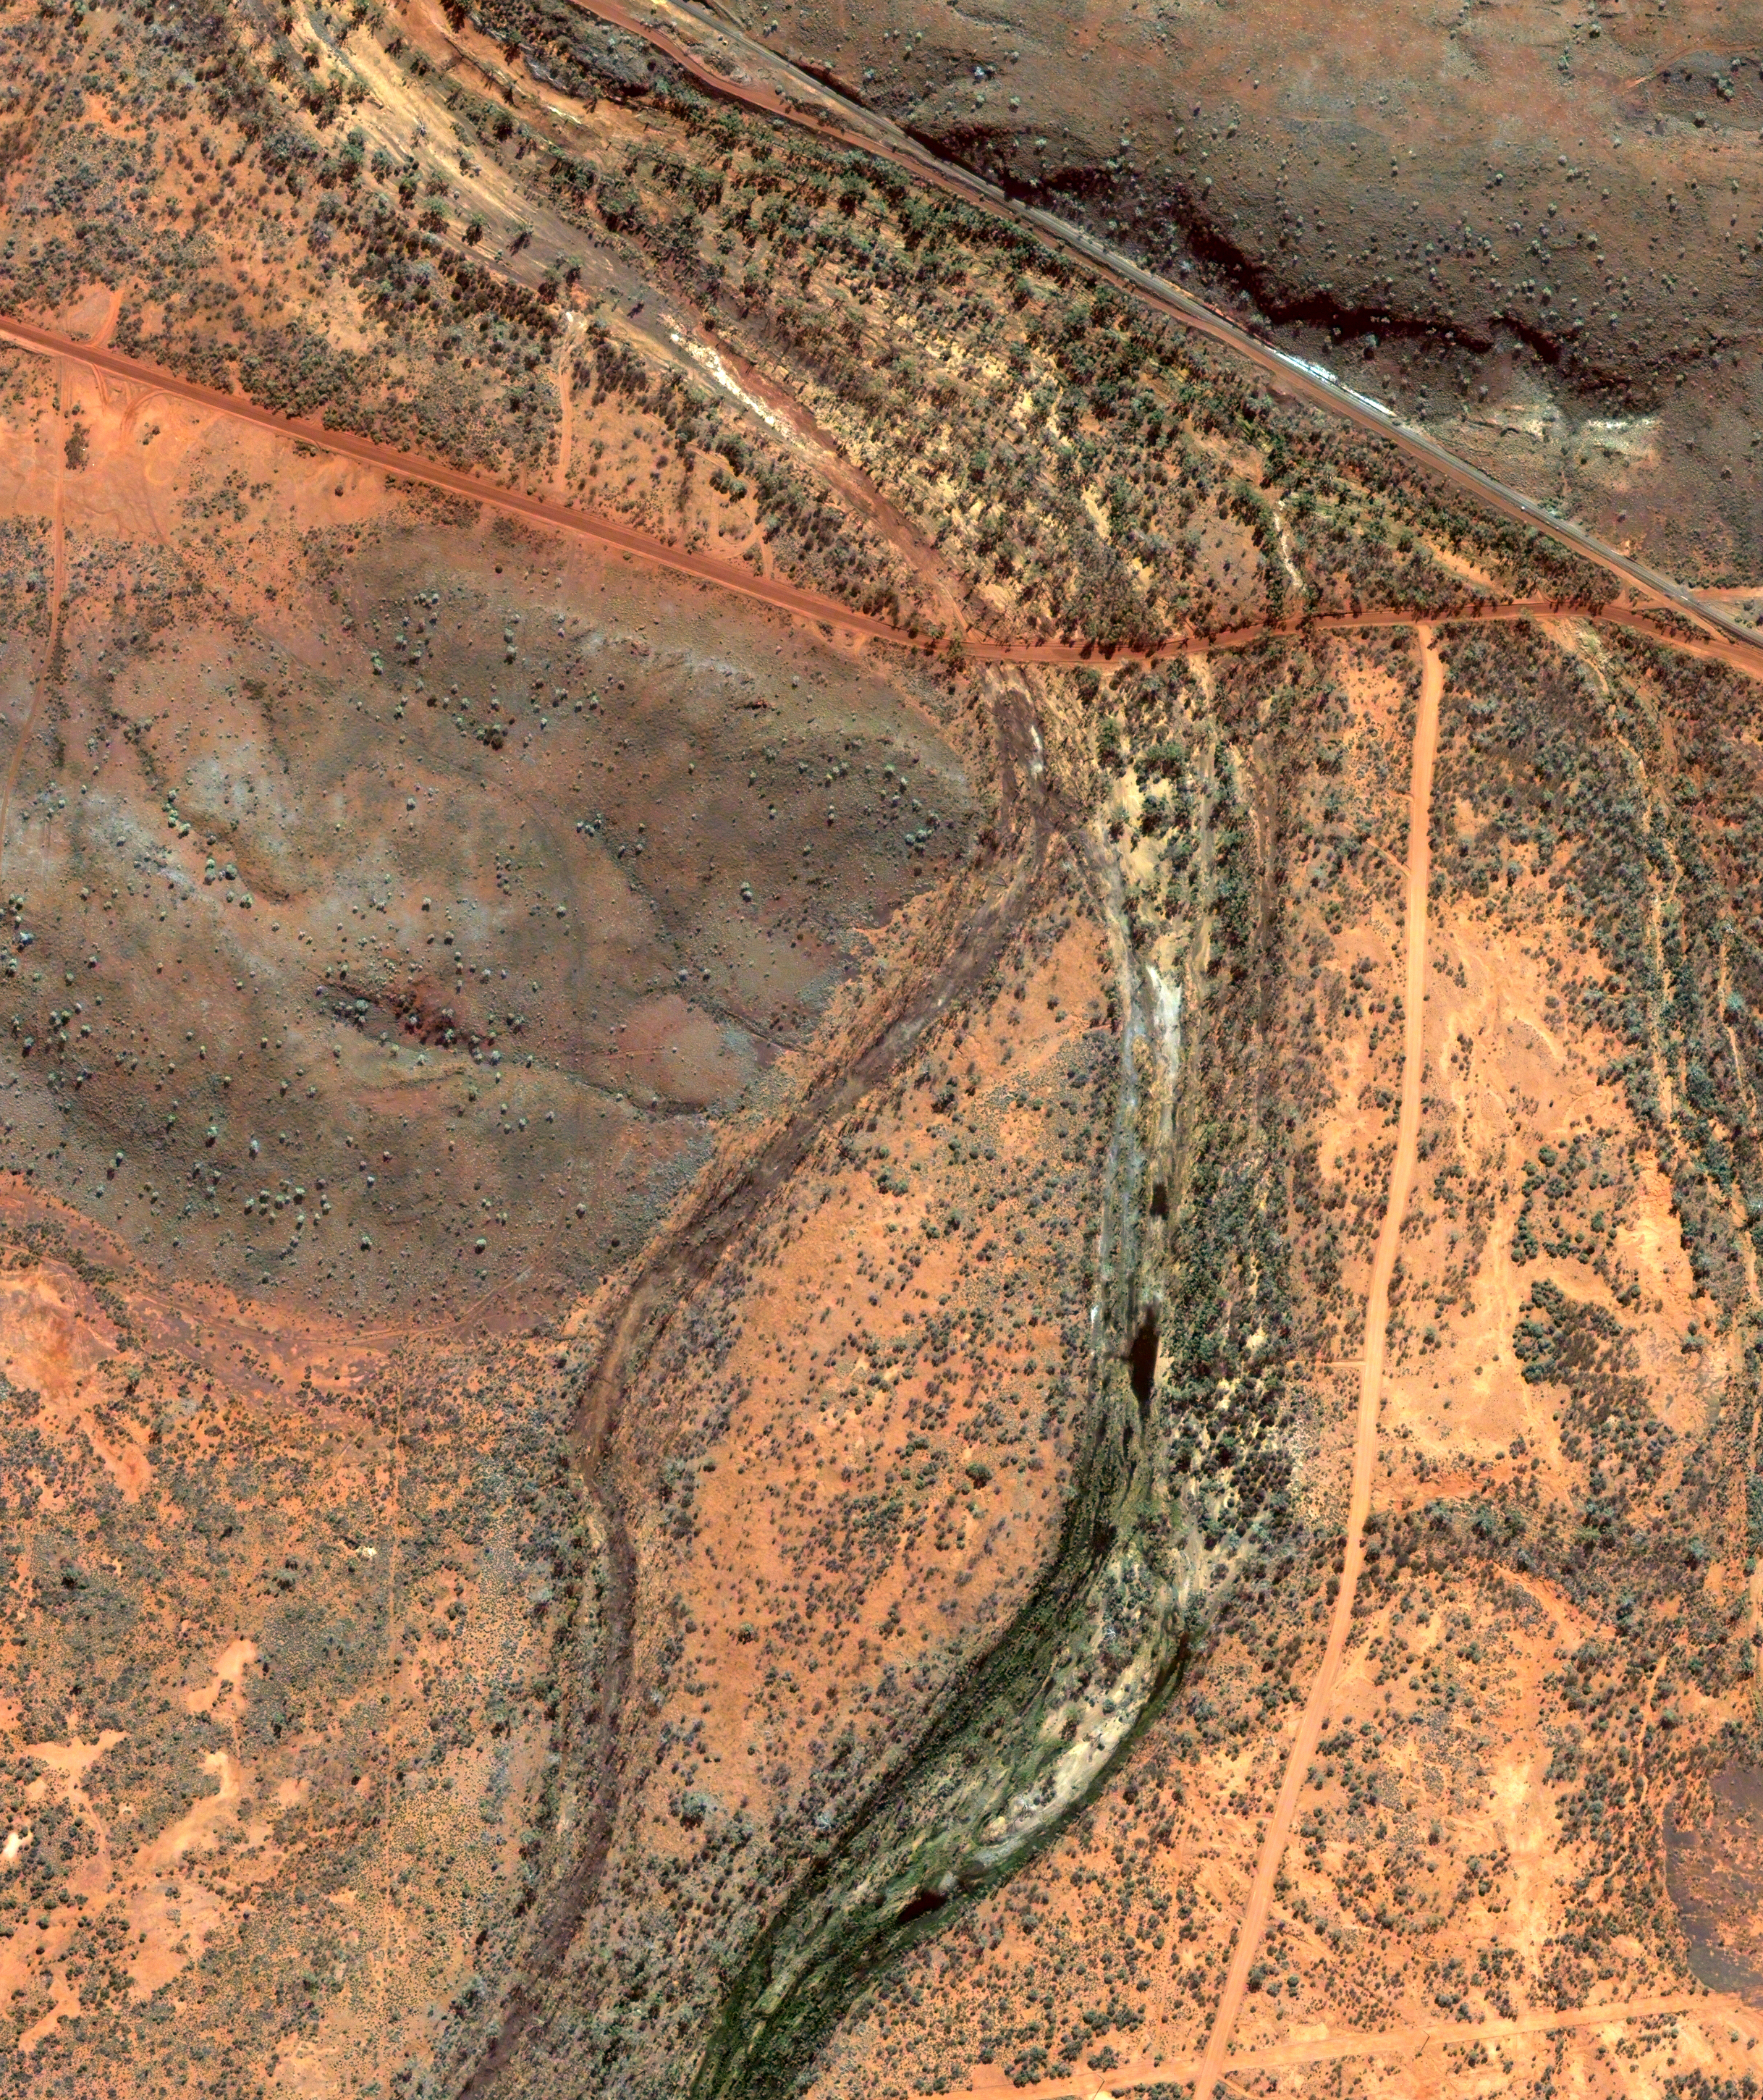 An example of the high resolution imagery available from satellites – clearly showing roads and even tracks (lower left, click to see a larger version)
With the relationship between Geoimage and Gaia Resources we can cover the whole disturbance mapping chain from end to end.
One of the key issues we have seen with long-term clients in disturbance mapping is the geographic positioning of the underlying imagery. If your imagery comes from different vendors, and you don’t rectify all to a particular baseline, you will see artificial changes in the imagery, as it ‘jumps around’ as you look between each year’s image. One of the first things we now ask is “what’s the baseline” and we bring the imagery in to be rectified against the baseline. Some customers think this is a bit pedantic, but it makes a difference the first time you want to overlay this year’s image with last year’s disturbance mapping.
Once we have the imagery sourced and rectified to the baseline, then the classification can begin. For first time clients, we tend to start from scratch and digitise from the image. We’ve been working on automatic classification through some Research and Development projects, and we are looking at this with Geoimage in the future.
For repeat clients, we undertake an automated “Area of Change” analysis which we use to outline areas where the image looks visually different from the previous years. This cuts down on the digitising time considerably, but does rely on you being able to have rectified imagery to the baseline, that also includes some colour balancing if possible to avoid false positives. In the end, though, we do a sanity check across the imagery as well, and then get to work outlining and classifying your disturbed areas.
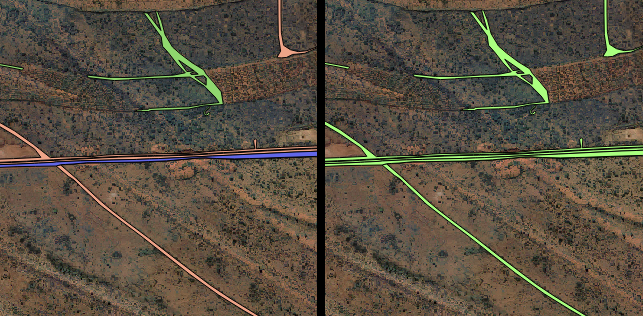
 An image from our testing process, where we review the classification against the underlying imagery (can you spot the track that wasn’t initially digitised and was found during our review?)
The final step is reporting. We have provided reports on a per-tenement basis (something you still need to do under the new MRF guidelines) which include maps and area figures. These reports are usually provided in a variety of formats including images, PDFs and spreadsheets to enable you to use the reports in a variety of ways. Of course, we also provide the spatial data (the image and the disturbance mapping polygons) in whatever formats are required there as well.
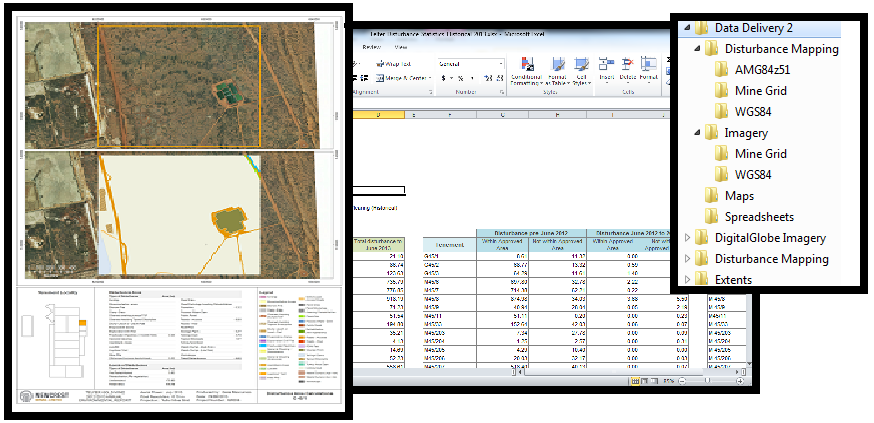 Examples of the final products – maps, spreadsheets and of course, raw data
If you want to discuss anything to do with disturbance mapping please call either myself or Natalie Dalgleish at Geoimage (our numbers are below) to have a discussion about how we can help. You can also leave a comment below, start a conversation with us on the Gaia Resources Facebook or Twitter accounts, or give either myself or Natalie from Geoimage a call on the numbers below.
Piers Higgs Natalie Dalgleish
(08) 92277309 (08) 9328 4772
Comments are closed.