You perhaps read January’s blog post on developing a simple dynamic Fungi field guide from available resources. Our GIS tiger team spent fifty hours to explore ‘what can you do help people visualise readily accessible spatial data for a significant group of organisms in their particular area of interest AND let them download a field guide for just those taxa’.
We combined skills in spatial interaction to query and visualise the available data with the transformation of resulting data into a well-formed PDF document. The Atlas of Living Australia (ALA) was the obvious choice for data acquisition as they provide an good range of web services to programmatically access and harvest their aggregated data.
Here’s what the team came up with for Fungi in the time available (illustrated below). You can read more about the issues in the previous blog post.
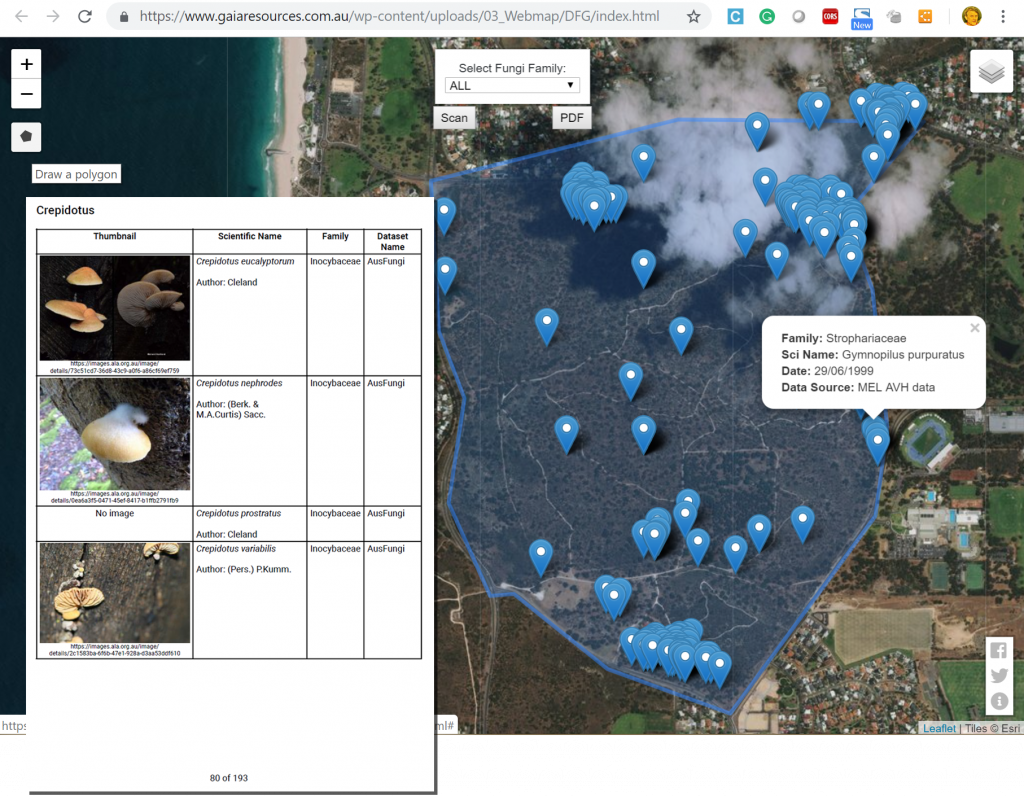
The interface we developed (with one of the field guide PDF files overlaid) – click on the image or here to try it yourself.
Given the success of this demonstration, our developers very quickly modified the code to also provide a Field Guide for Insects and then a Field Guide for Green Plants.
The operation of the mapping interface remains the same:
- select your family of interest, or leave it set to ‘ALL’ families. The available families in the drop-down have been generated from a query of the ALA;
- select the drawing tool on the left to draw a polygon around your land area of interest. (note: from the layer selection icon in the top right you can choose to display a street-map or a satellite image base layer);
- press ‘Scan’ to display the available points within your defined area;
- click on a point to display some metadata about the record;
- it is possible to select a different family to display and the results will be automatically displayed;
- when you have your preferred data set, hit ‘PDF’ to generate a field guide to the area;
- a well-formed PDF document containing a table of species ordered alphabetically by family, genus and species, as illustrated in the inset above;
- each table row ideally contains a referenced image (so that you can follow up on the creator and usage information), scientific name and author, family, and the contributing dataset.
This project continues to provide informative case studies for producing useful products from authoritative public datasets. It could be expanded upon and further configured to produce field guides for any other major taxonomic group. Given more time we would have liked to add point clustering and record counts to the map, a dynamically generated drop-down list of only the families occurring in the defined area and improved image attribution. The layout of the PDF could be further refined with the inclusion of a map of the area queried, a species index, and refined content presentation.
We’d again like to acknowledge the ALA for its continuing commitment to aggregating the scientific resources to provide a national view of Australia’s biodiversity, and the many image and data contributors to the ALA.
If you’d like to give us your feedback on these webmaps or have the need for a customised version of these online tools, then please leave a comment below, start a chat with us via Facebook, Twitter or LinkedIn, or email me directly via alex.chapman@gaiaresources.com.au.
Alex
Comments are closed.