With our strong background and interest in all things spatial here at Gaia Resources, we’ve just begun a round of R&D around the web mapping technologies that are available, and to do that Piers has set us a few “challenges”. The first was to create an interactive map of the locations where we have done projects.
We recently ran an internal evaluation of a range of web mapping technologies and one of the ones we wanted to get ourselves an update in was CartoDB. I know Piers and Andrew have been followers of Javier and his team as they have developed CartoDB from their early days, and have seen many developments and iterations of the software come along. It seemed like a good time to have a go at this first challenge using CartoDB software, and it is an area I’m particularly interested in myself, so I got the go-ahead to get it sorted!
The end result is embedded below:
Firstly, though, we had to capture the places where we have done work. To do this, we used our own GRID instance to capture the centroids of areas where we thought we’ve done work. It’s been an interesting exercise for me as a relatively new starter at Gaia Resources to go back over nearly 500 projects (the next job we win will be our 500th job!) and 12 years of work to see the wide range of work that we’ve done. We’re still going through and checking the locations – often we will have done projects that cover wide geographic extents, or a wide range of things, and so finding that elusive centroid – that is appropriate – requires a fair bit of detective work! That will be an ongoing process for us to keep tuning this source data. Once we had this data captured via GRID, we could then extract it in a CSV format, and then use that to power our CartoDB map separately (we have yet to investigate the WMS capabilities but that’s on the list).
Once the data was collated, though, it was pretty easy to get an embeddable web map set up for this blog post. CartoDB does most of the heavy lifting back-end processes for its users, so it is quite a short introduction to become acquainted with the website. For this instance it was as simple as a quick registration process, and basically a “drag-and-drop” of the CSV format data into my CartoDB datasets dashboard. We were now able to create a map and customise it with a range of handy tools ranging from symbology wizards, sql statements, css control, and filters. Once the map was ready for publication CartoDB gives you a few options; a URL link, a JavaScript file, or how we intended to use it – an embeddable iframe link.
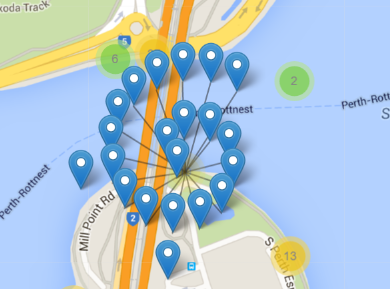 Once we did embed it, we found a few little things we’d need to do to make this jump through the hoops we want to. Since we have points “on top” of each other, we found out that you can’t use the info tool to dig deeply into those points, so we thought about clustering the points instead. Clustering works reasonably well out of the box, but you’d have to put in a workaround to get it to explode the points out and display the attributes using the info tool (like we’ve done in the Leaflet maps we’ve done in the past, like this one or the picture on the right), so we left it off for now. We’re just doing some reviews of this “simple” installation to pick up on things like that, and we’ll be collating this sort of information.
Our evaluation on all of the web map tools we’ll be trying out will be collated in a future blog post, but certainly this one with CartoDB was an easy one to implement. If you are interested in finding out how we can help with your web mapping needs, then leave me a comment below, email me or start a conversation with us on Facebook, Twitter or LinkedIn.
Jake
Comments are closed.