Throughout the entire time Gaia Resources has been operating, data has been the key to many of our projects. Particularly for our spatial projects, maps and data analysis cannot be undertaken nor relied upon without suitable data. Lately there’s been a lot of discussion in various industries that “spatial isn’t special” and that there is a lot of movement towards making more data and tools readily available. This is a double edged sword.
Specifically, making everything available doesn’t do anything about the quality of what you do with it. Sometimes, notably in hackathon events, you can get some brilliant minds that normally sit outside of the ‘usual’ circles to produce some amazing results that are true and accurate reflections of the data. But we are starting to see a lot of products out there that are displayed at inappropriate scales thereby distorting the accuracy or true intent of the data (perhaps this post all comes about from a recent re-read of “How to lie with maps“).
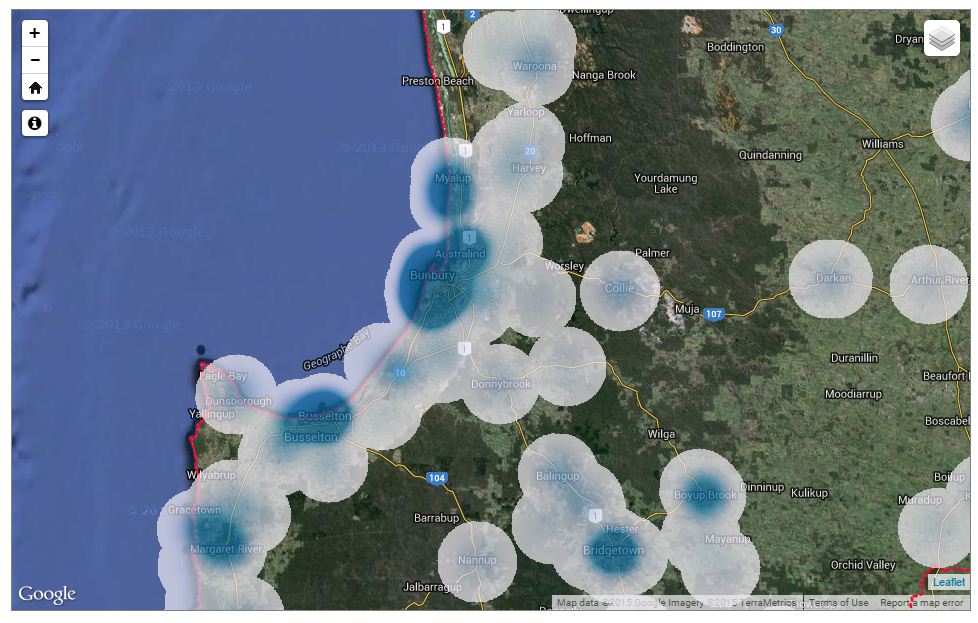
This looks great, but what does it actually say?
I was recently chatting away with a mate of mine and about this, and an example of that came up – one that looked at large scale interpolated data. One particular cell (these were 1 degree of latitude and 1 degree of longitude in size) had a marked difference to the cell next door. The person using it looked at it and went, well, it’s OK, we’re 100m inside that area with the lower value. This showed a basic misunderstanding of the nature of this data – interpolated data, gridded up to any sort of cell, shouldn’t be used in this sort of evaluation.
This is one of the things we try to teach along the way in our QGIS training (which is specifically aimed at non-spatial professionals in the environmental industry), namely the importance of looking properly at your data, and understanding it. This way, we’re hoping that a few of these mistakes are not repeated in the future (and if you’re interested in this, contact us at training@gaiaresources.com.au to find out more about this course, there’s one planned for November).
We’ve been also looking heavily at ways to help groups manage their spatial data, and that helps them to understand it better. Too often we’ve seen maps produced that use data that turn out to have a doubtful provenance. So a lot of the time in the last year, we’ve been working with groups to help them sort out and understand their data. We’ve boiled down the essence of spatial data management to the simplest we can, and we’re implementing simple and easy to use processes to make sure that spatial data management is something that we can sort out, and then get a group to be self-sufficient in, quickly.
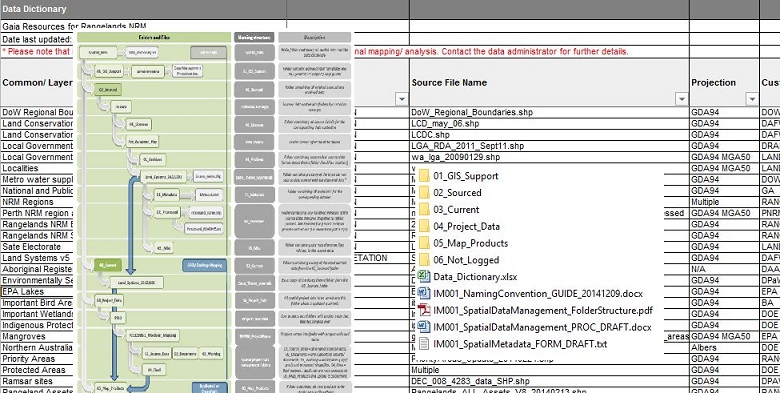
It’s really difficult to find a picture that says “data management”… but simple spreadsheets, folders and procedures can deliver the goods
There’s also the legacy of the ‘old ways’. Gaia Resources started eleven years ago by looking at how to take historical legacy data from hardcopy reports into the digital age, and we’ve continued to do that over time. We not only have been capturing data for clients (from our early days with Rio Tinto’s Environmental Characteristics and Capabilities project, to our latest work with the State Environmental Data Library for the Department of Mines and Petroleum), but also building simple systems to help them view, manage and publish their data across various sources. This is an area that our work with groups like the Natural Resource Management (NRM) community has been very strongly focused on – our GRID product really helps facilitate this.
Finally, while data is key to a lot of things, it’s what you then also do with it – the analysis side. There are a range of different analyses that you can start to do once the data is in order, and some of the work we’ve done in the past like the South West Australian Ecoregion Initiative, and the State Wide Dieback Framework, really show you what can be achieved when the data is available and ready to be (appropriately) analysed. We’ve also been playing around lately with some other analysis methods and there will be a couple of follow up spatial analysis blogs in the near future from our team.
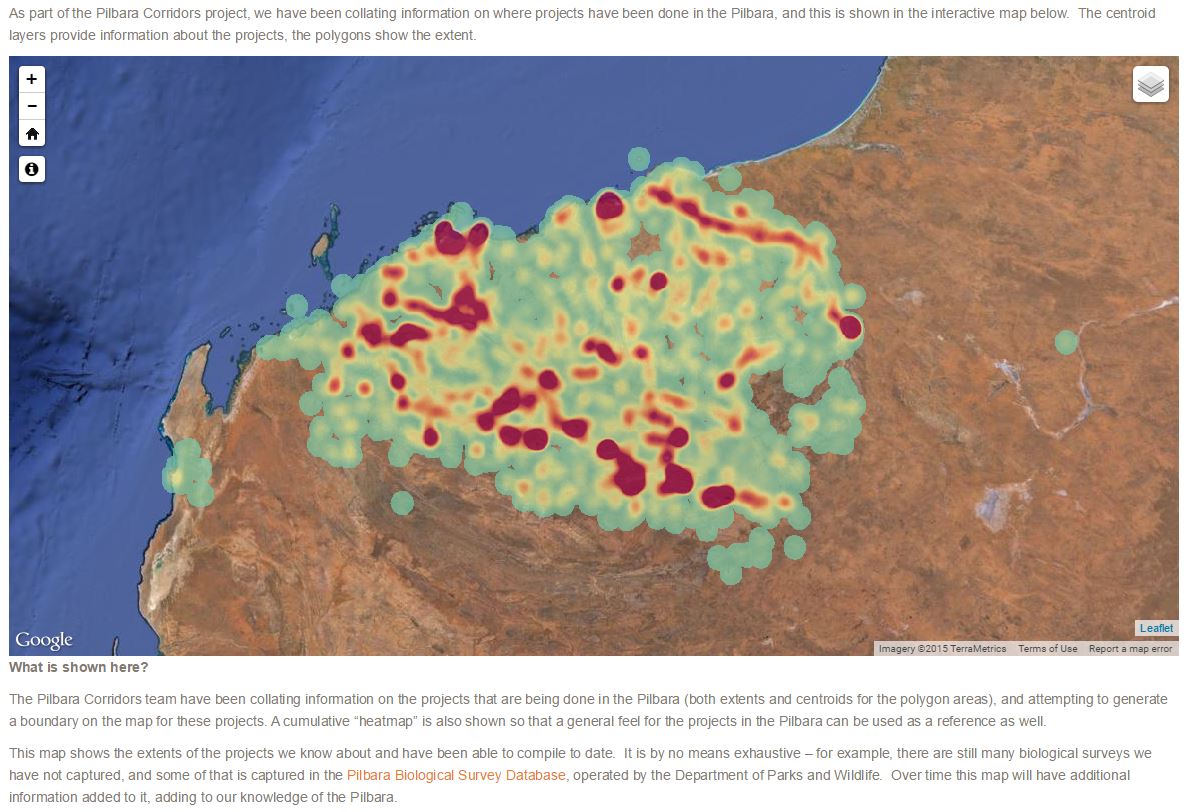
Analysing patterns and influence is just one of the things that spatial technologies can do, as we’ve done (and made widely accessible) in the Pilbara Corridors project
So, while spatial technologies no longer have the barriers to entry that they once did, there’s a lot of the industry still geared up to protecting the ‘ivory tower’ mentality. It’s something that we don’t subscribe to here, and instead we’re looking at making spatial technologies more readily understandable, available and useful for a range of different uses – but always remembering to look at the quality.
Piers
Leave a comment below, or start a conversation with us on Facebook, LinkedIn or Twitter.
Comments are closed.