In 2010, as a third year environmental science student, I undertook a study project that would give me nightmares about ants for a good 6 months beyond its completion. Construction of Fiona Stanley Hospital was underway and I was tasked with measuring the ecological health of various patches of bushland across the hospital site, along with reference and rehabilitation sites in Beeliar Regional Park. To do this we used ants as indicator species and sampled ants from 100 pitfall traps across each of the sites.
Back at the lab my first job was to sort each of the pitfall traps, separating ants from other critters and debris using a microscope and a couple of dissecting needles. Considering some species were approximately the size and colour of a grain of sand, this was not always the epitome of fun. One trap had 781 individual ants in it. My supervisor, an entomologist and ant enthusiast, helped with the identification. At one point he sternly called across the lab, “Tracey… why is this ant in three pieces?”
From the data collected I was able to report on the composition of ant communities, suggest indicator species, and interpret ecological health of the sites.
Fast forward to 2015 and, like so much environmental data, this useful plethora of ant information was sitting on a hard drive doing nothing. I may be biased but I like to think all that effort should deliver more than a standalone report. I wanted the data to be available as a baseline for future studies, and the only way to do that was to make it publicly available. Ant data is particularly valuable as not only are ants a tremendous indicator species, but invertebrate data can be scarce as it generally requires experts to identify species.
I cleaned and formatted the data for upload into Gaia Resources’ Biological Data Recording System (BDRS) and created a project page in the Citizen Science Hub. As a result, not only was my data now publicly available but users could visualise it on a webmap and pull out customised shapefiles and spreadsheets. Using QGIS, I created, among other things, a map of species richness and abundance of Iridomyrmex chasei – the genus of which is renowned for its dominance in disturbed areas thus making it a good indicator of ecological health (such as in Bisevav & Majer 1999, Hoffman & Andersen 2003, and Andersen et al. 2004).
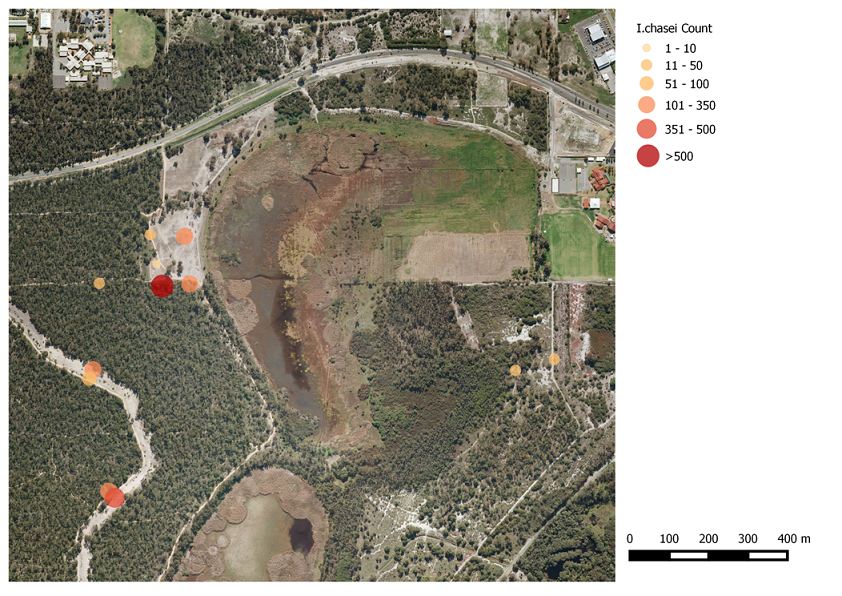
Figure 1: Sample of abundance map for Iridomyrmex chasei.
The compulsory fields in the BDRS ensure that each data point is accompanied by a geocode, datestamp and species name, which means that the data can be shared across a wider range of groups using some of the international data standards that the BDRS supports. In addition, my study could even be replicated – apart from those sites that are now sitting in one of the wards of Fiona Stanley Hospital! The original report can be found here as supporting documentation for anyone that loves ants so much that they would like to replicate my study in full and has a spare lifetime to identify the ant species.
This is an example of how historic, local data can be made publicly available and hence useful for biodiversity snapshots, baseline data and future comparisons. If you would like more information on the 2010 study or would like to upload data of your own, please contact me, or start a conversation with us on Facebook, Twitter or LinkedIn.
Tracey
REFEERENCES
Andersen, A., Fisher, A., Hoffman, B., Read, J. & Richards, R. (2004). Use of terrestrial invertebrates for biodiversity monitoring in Australian rangelands, with particular reference to ants. Austral Ecology. Blackwell Science Ltd. 29: 87-92.
Bisevav, L. & Majer, J. (1999). Comparative study of ant communities of rehabilitated mineral sands mines and heathland, Western Australia. Restoration Ecology 7(2): 117-126.
Hoffman, B. & Andersen, A. (2003). Responses of ants to disturbance in Australia, with particular reference to functional groups. Austral Ecology 28: 444-464.
Comments are closed.