Controlled burning is underway across the western and central parts of tropical north Australia. As we move into the dry season and the floodways on our Top End roads become accessible, indigenous groups, parks managers and farmers are keen to get those early season burns in full swing. This type of fuel mitigation burning happens at a time of year when there is moisture in the soil and vegetation, in order to limit more catastrophic bushfires later in the season when everything has dried up. It reminds me of the explanation Dom Nicholls from the Mimal Rangers gave me over a coffee chat last year, when he said in East Arnhem land they begin their programs as early as they can get the flames to take hold in the grassy vegetation – in March if they can get road access – and then race to fill the gaps later using fire scar mapping and careful planning.
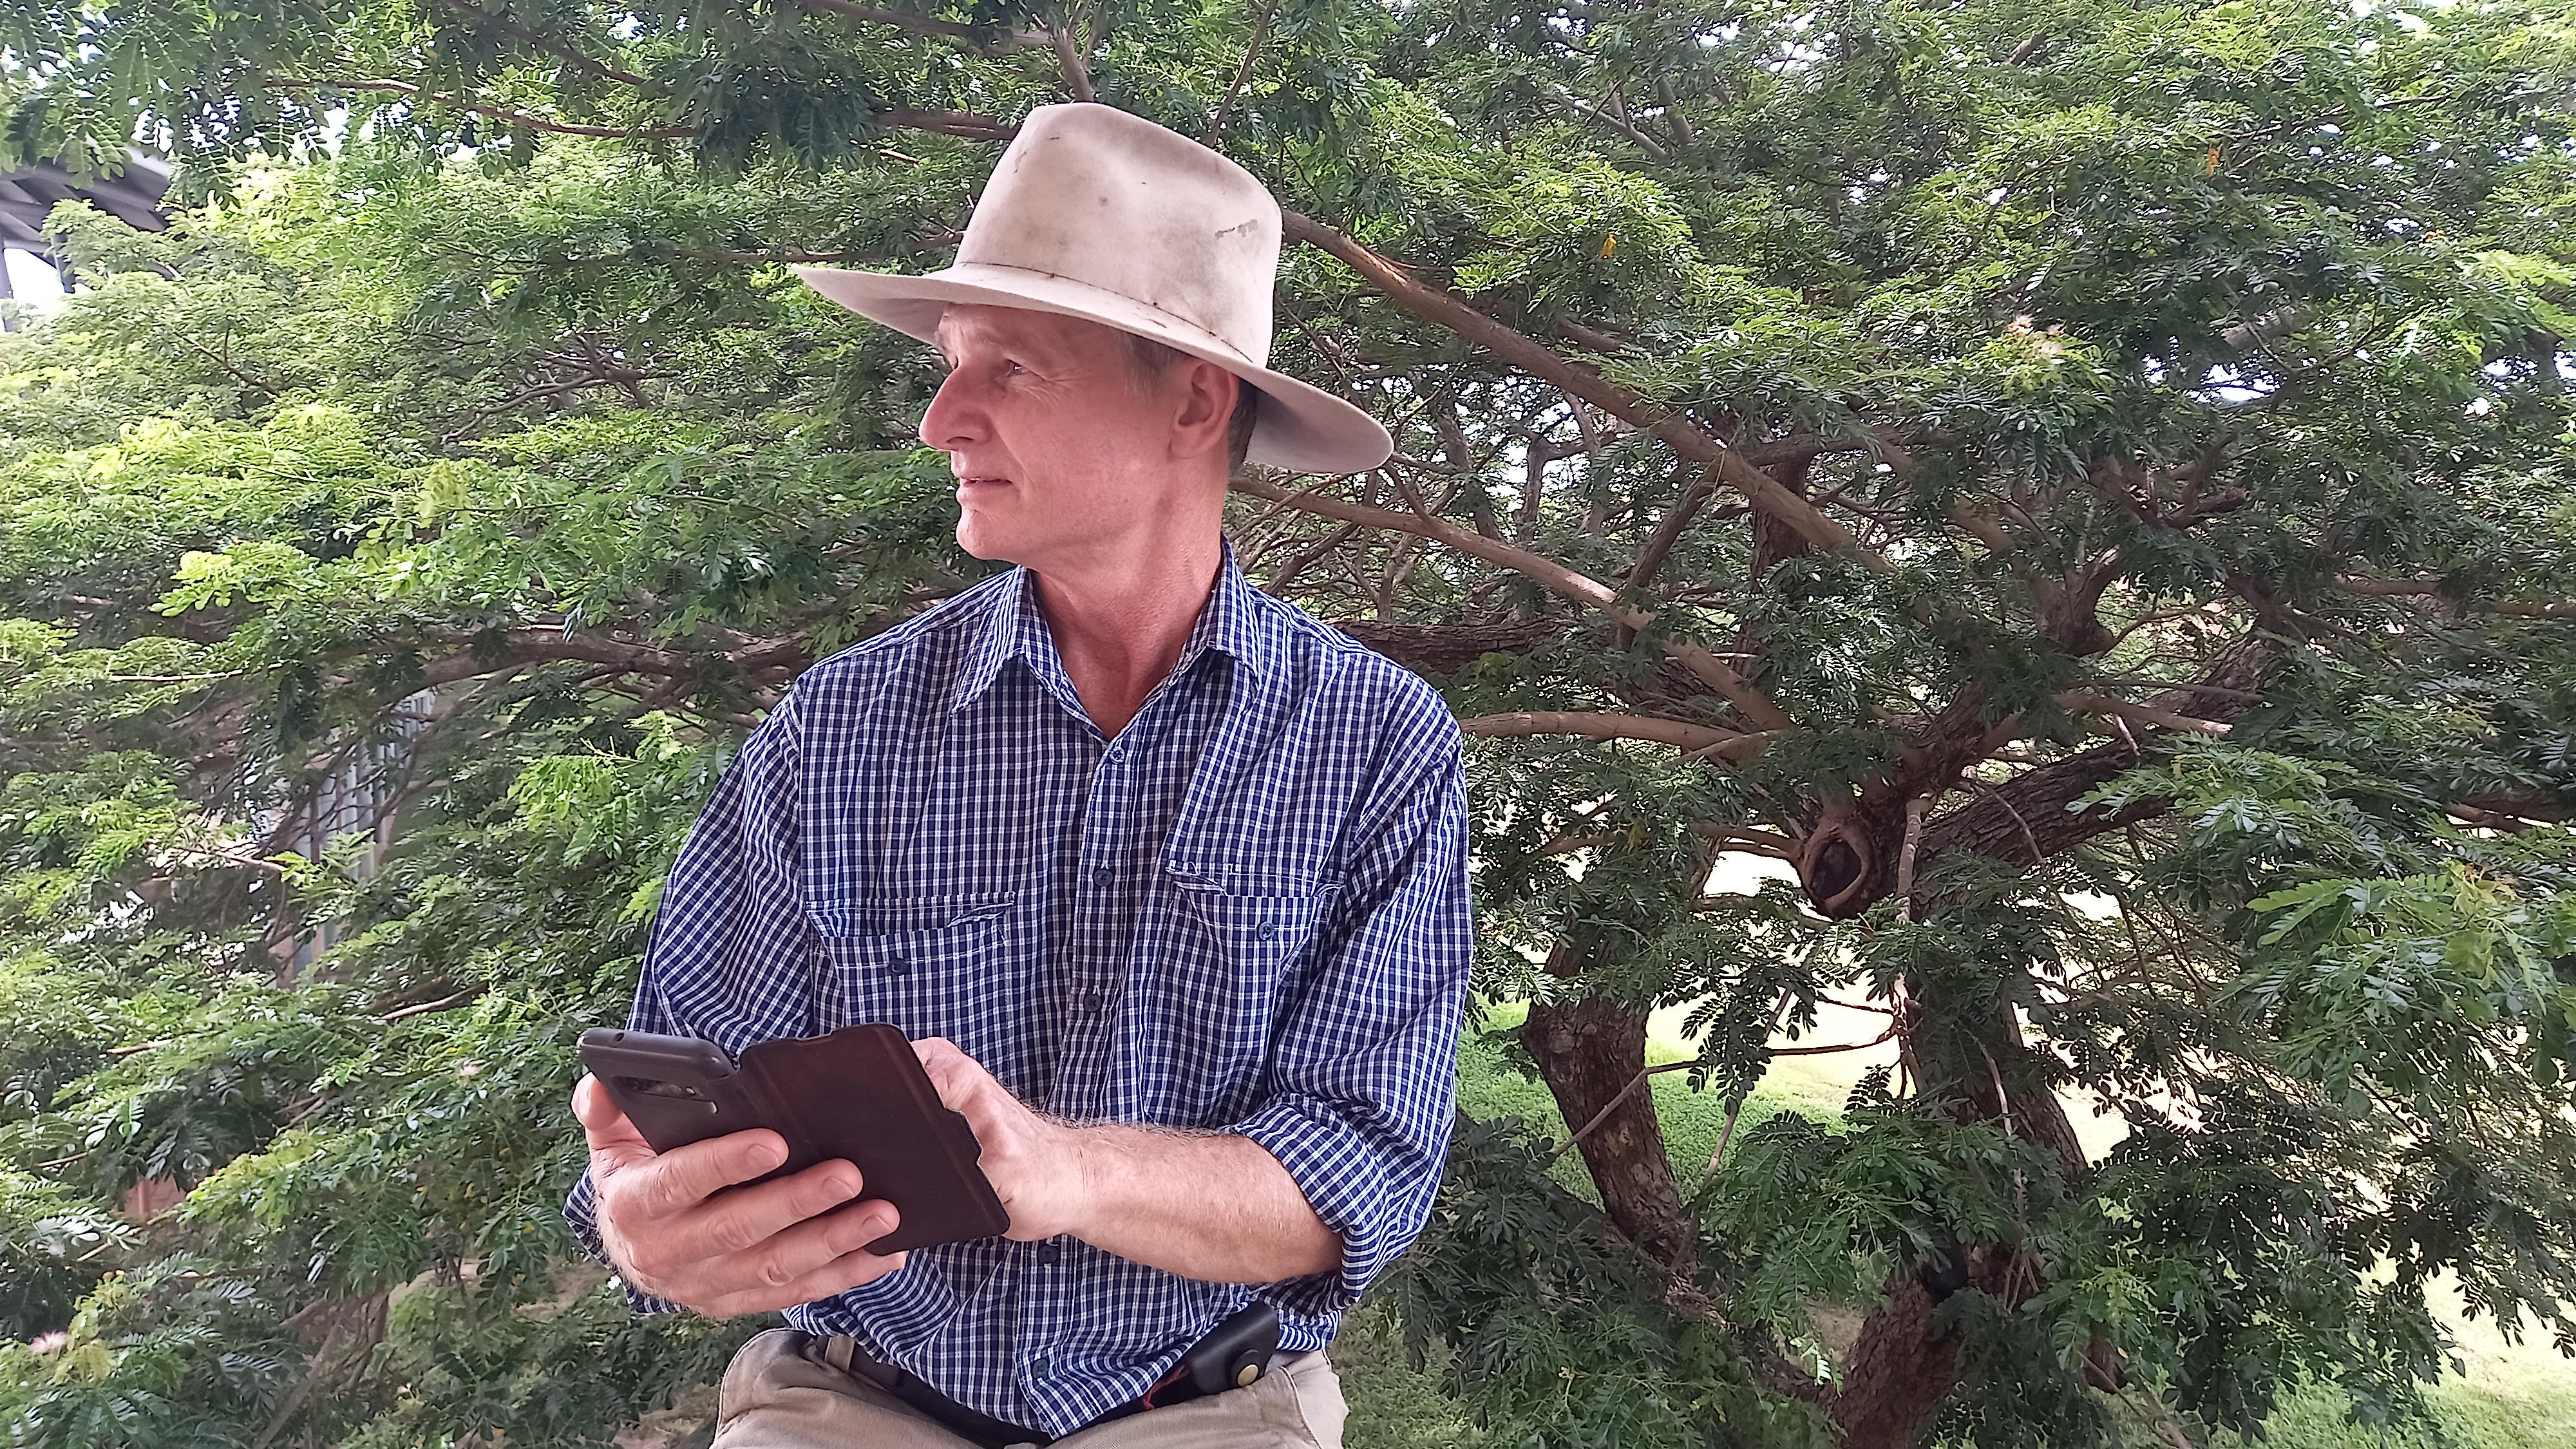 Farmers like Mark Desaliy can use the app to monitor fires near their stations.
Our initial release of the North Australia and Rangelands Fire Information (NAFI) app for iOS and Android back in February brings the most used fire information resource for land managers in Australia to your phone, allowing you to keep a constant eye on bushfire threats. You can view maps of satellite generated fire activity (hotspots) and burnt areas (fire scars) provided by the NAFI service. There’s a good summary back in March from Rohan Fisher on ABC Radio – Kimberley.
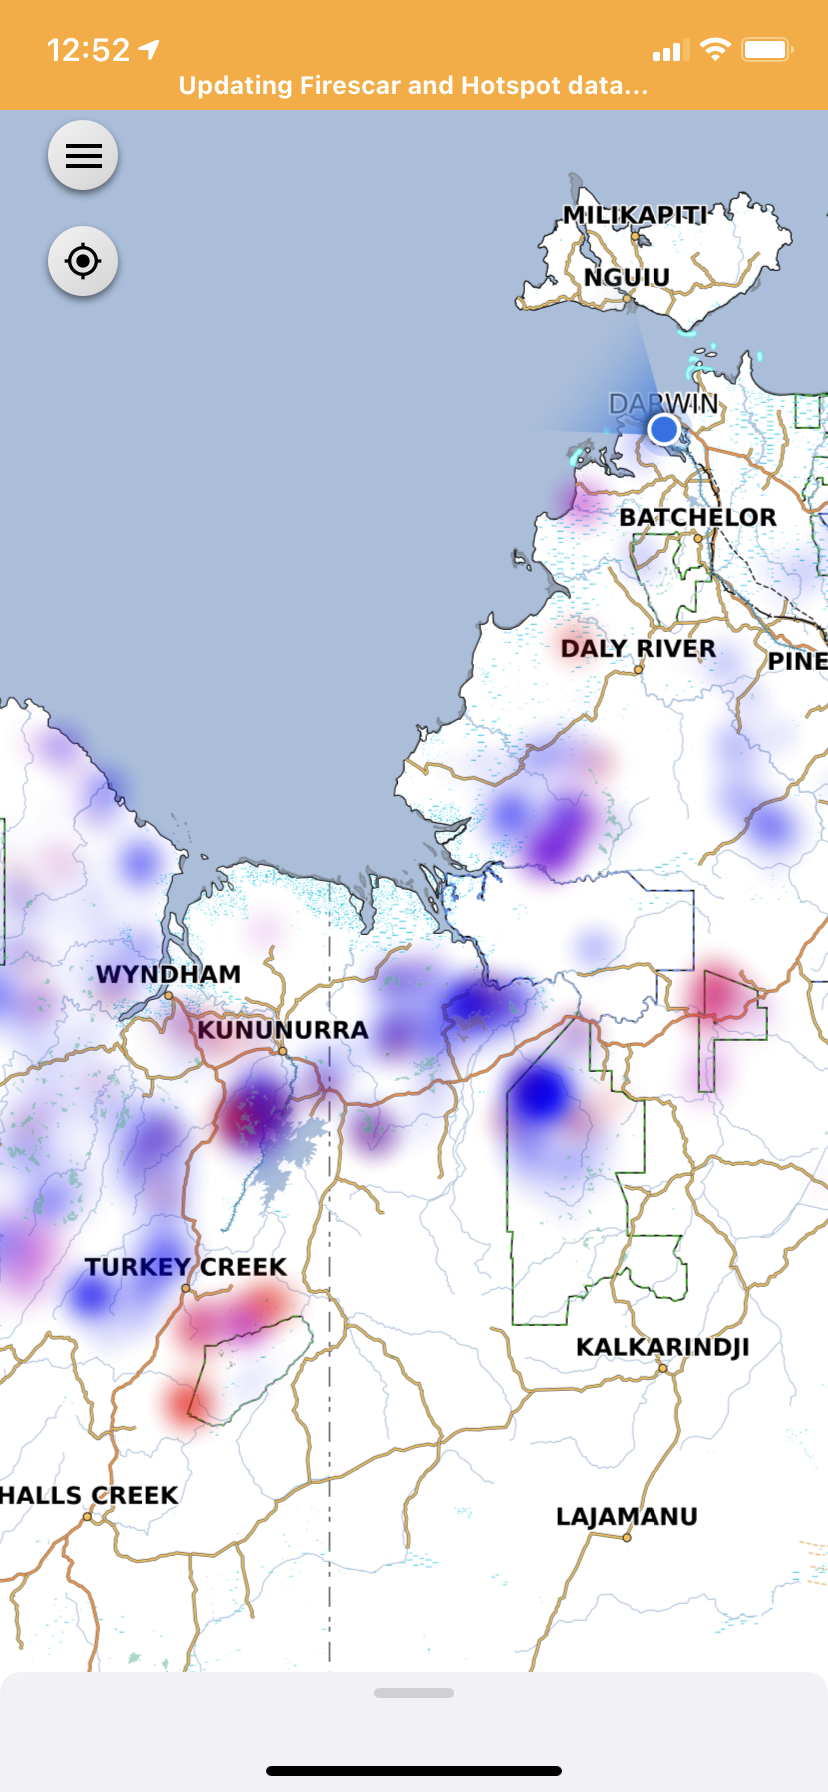 At a regional scale like this area in northern NT and WA, the NAFI app represents real-time hotspots through a heat map clustering algorithm.
Just to recap on how the app works behind the scenes to provide you with real-time fire information:
- The hotspot locations are updated several times a day and the fire scars are updated up to once or twice a week depending on fire conditions.
- The fire scars are produced by the NAFI Service and the hotspots are sourced from Landgate WA and Geoscience Australia.
- Base maps for imagery and topography can be downloaded for offline use in your region of interest, and then used for when you go outside of mobile data range.
- Burnt area mapping covers the Australian Savannas and rangelands that comprise around 70% of Australia, but does not cover NSW, VIC or the heavily populated regions of QLD, WA and SA.
So how popular is the NAFI app – well we can monitor a number of analytics using iOS AppStoreConnect and Google Play console, or the Firebase dashboard. These are configurable dashboards that can tell us things like how many installations occurred by day or week, how many are actively used, and filtered by operating system or device type. As of today, the iOS app has been downloaded 288 times since it’s initial release, and the Android version 142 times.
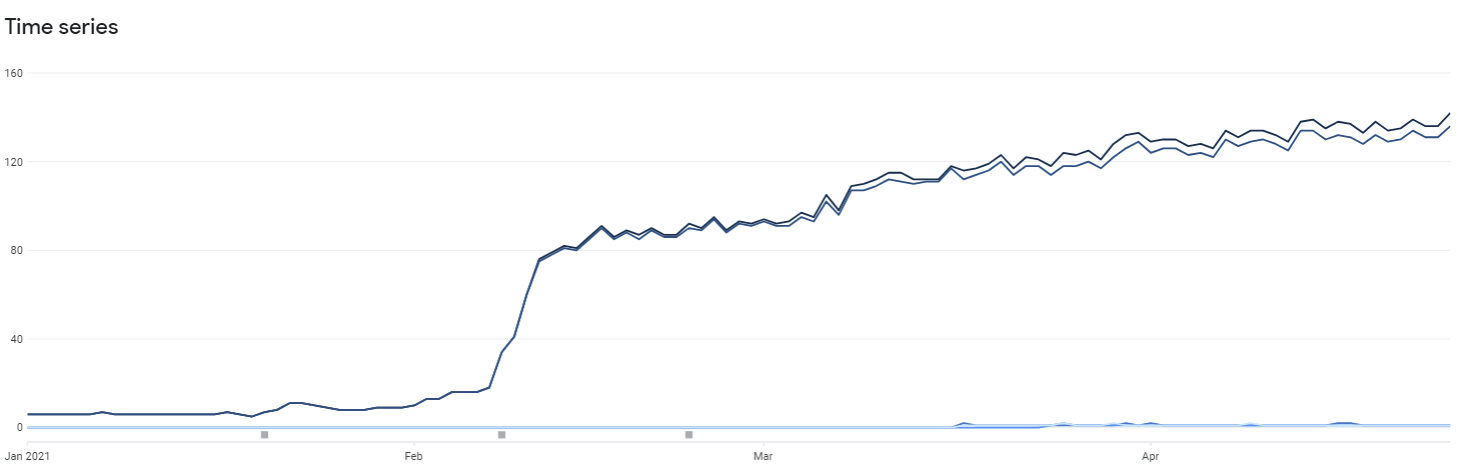 Google Play Console shows the increase in installations of the Android NAFI app over time since the mid-February release.
We expect installations to continue upwards in the month of May and beyond, as more people on the ground become aware of the benefits and utility of the app. There are two phases of bushfire related activity where the app can be useful, associated with the early Dry season burn programs and carbon (emission reduction) projects, and the late Dry season bushfire response.
The statistics are anonymised so we are not tracking personal information, but what the out-of-the-box analytics does help us to understand are the trends, and – along with ratings and word of mouth – we get a bit more insight into how people are reacting to the app. This can then feed into our strategy with clients on helping them target marketing campaigns and prioritise enhancements. We also utilise Firebase Crashlytics as a way of logging the details of any crashes and error messages received, and this really helps us get quickly to the root cause of a technical issue a particular user is experiencing.
Please be aware if you are using the app:
- Hotspot location on any map may only be accurate to within 1.5 km
- The hotspot symbol on the maps does not indicate the size of the fire
- Some fires may be small, brief, or obscured by smoke or cloud and go undetected
- Satellites detect other heat sources such as smokestacks
For more information visit: https://savannafiremapping.com/nafi-mobile-app/
If you would like to know more about our projects with the NAFI team, or want to strike up a conversation by sending me an email or getting in touch on Twitter, LinkedIn or Facebook.
Chris
Comments are closed.