My colleague Rocio recently wrote about her team winning a NASA global hackathon, with their prototype solution to monitor movement in trees from satellite imagery as an indicator of landslide risk (read about that here). It inspired me to do a bit of research and a refresh on my knowledge of common and not so well known satellite platforms out there for environmental monitoring.
[Caveat – I cannot claim to be an expert in either environmental science or remote sensing disciplines, but I know there are many of us in the same boat. It’s tricky to keep track of it all, so I thought if I shared some information and tricks on how to use this data then hopefully I can give a few people a leg up.]
Satellites and remote sensing have played an important role for decades in monitoring land cover change, marine and climate conditions; but developments in this field have increased dramatically in recent years. New satellite platforms, cloud computing, computational capabilities, and free and open access data have allowed scientists and researchers to get their hands on more and more data ready to use for particular environmental applications.
There are some heavy hitting satellites out there that scientists and researchers would know and love – or hate depending on their context! MODIS, Landsat and Sentinel platforms (outlined in the table below) provide imagery at different resolutions, multispectral band combinations and revisit frequencies. For example, a scientist concerned with bushfire risk may leverage all three in different contexts to provide temporal and spatial coverage across such a complex issue spanning vegetation condition, climate/weather and fuel loads. For other applications, one can get a lot out of one satellite platform.
Table 1: Overview specifications of some of the most popular satellite platforms used for environmental monitoring applications.
| Satellite | Description | Sensor type/product | Resolution (m) | Frequency |
|---|---|---|---|---|
| MODIS (Terra and Aqua) | Atmospheric, land, and ocean multispectral imagery, including 36 bands | Moderate Resolution Imaging Spectroradiometer | 250m
500m 1000m |
Twice daily |
| Landsat 7 | Multispectral imagery, including 8 bands | Enhanced Thematic Mapper+ (ETM+) | 30m
15m |
16 days |
| Landsat 8 | Multispectral imagery, including 9 bands | Operational Land Manager | 30m
15m |
16 days |
| Thermal imagery, including 2 bands | Thermal Infrared Sensor (TIRS) | 100m | 16 days | |
| Landsat 9 | Multispectral imagery, including 9 bands | Operational Land Manager-2 | 30m
15m |
16 days |
| Thermal imagery, including 2 bands | Thermal Infrared Sensor (TIRS-2) | 100m | 16 days | |
| Sentinel | Synthetic Aperture Radar (SAR) imagery | Sentinel-1 | 5 x 5m
5 x 20m 20 x 40m |
6 days |
| Multispectral imagery, including 13 bands | Sentinel-2 | 10m
20m 60m |
5 days |
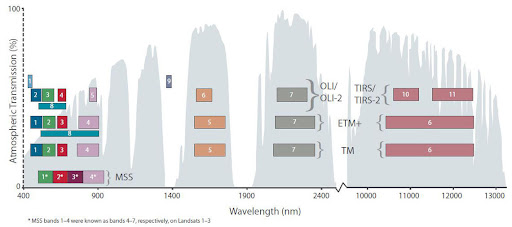
Spectral band comparison between Landsat 5 (TM), Landsat 7 (ETM+), Landsat 8 and 9 (OLI, OLI-2).
The Landsat mission spans six decades, and an archive of free historical imagery archives is readily available going back as far as 1972. With each launch – most recently Landsat 9 in September, 2021 – NASA have made progressive improvements in technology and spectral parameters while maintaining data consistency and a long-term monitoring record. Landsat 9, for instance, includes the same spatial resolution but with higher radiometric resolution (14-bit quantization compared to 12-bit for Landsat 8). This allows sensors to detect more subtle differences, especially over darker areas such as water or dense forests. For instance, Landsat 9 can differentiate 16,384 shades of a given wavelength, compared to 4,096 shades in Landsat 8, and 256 shades in Landsat 7 (source: USGS).
What I find amazing is how close these satellites’ orbits really are to us – at between 700-800km altitude, these things are imaging the Earth at a horizontal equivalent less than the distance between Sydney and Melbourne, and whizzing past at 26,972 km/hr!
GIS packages like QGIS and other analytics platforms can ingest and visualise satellite data in a number of formats. You can either download the imagery directly from their online portals – such as the USGS Earth Explorer and the Copernicus Open Access Hub – or connect to web map services in the form of WMS and WMTS layer types.

QGIS shows a Landsat 9 imagery for Perth (left) with the higher resolution Sentinel-2 imagery (right).
The QGIS plugin repository contains a number of freely available plugins offering access to satellite base map services, and others with easy to use facilities to search and download the raw imagery for analysis. Still others offer spatial layers derived from these satellite sources – and the NAFI plugin we developed is one of the many
Google Earth Engine (GEE) is a platform we’ve started to use for analysis and visualisation of geospatial datasets, and it is accessible for academic, non-profit, business and government users. We were able to process large volumes of imagery to detect changes in forest cover and vigour against a long-term baseline (read more about that project here). GEE hosts publicly available satellite imagery with historical earth images going back more than forty years. The images are available globally, and ingested on a daily basis to really make it powerful for monitoring and prediction applications. It also provides Application Programming Interfaces (APIs) and other resources like Jupyter Notebooks scripts to enable the analysis of large volumes of data.
Earth on AWS is another source of open data that helps you discover and share datasets for geospatial workloads. AWS Marketplace has a large number of geospatial, GIS and location-based applications that can benefit planning, predictive modelling and mapping applications.
This movement towards free and open-source satellite data – and the growth of enabling platforms – offers incredible opportunities for environmental scientists, encouraging new questions to be explored at regional and continental scales.
At a talk organised by the Research Institute for the Environment and Livelihoods (RIEL) back in 2019, I was introduced to a few lesser known satellite platforms that have plenty to offer for environmental monitoring. The table below provides a just a bit of a snapshot, but I am certain there are many more out there and I am only scratching the surface:
Table 2: Overview of other satellites used for environmental monitoring. Links are provided to specifications and available products.
| Satellite | Mission/Purpose | Sensor type/product | Resolution (m) | Frequency |
|---|---|---|---|---|
| Himawari 8 | Near real time weather satellite used for weather imagery. | Advanced Himawari Imager (16 bands) | 500m
1000m 2000m |
10min |
| Global Ecosystem Dynamics Investigation (GEDI) | To understand how deforestation has contributed to atmospheric CO2 concentrations, how much carbon forests will absorb in the future, and how habitat degradation will affect global biodiversity. | LiDAR (Light Detection and Ranging)
Products include: – canopy height and profile, – ground elevation, – leaf area index, – above ground biomass. |
25m
1000m |
Variable |
| EnMAP hyperspectral satellite (planned launch in 2022) | To monitor ecosystems by extracting geochemical, biochemical and biophysical parameters on a global scale. | Hyperspectral band imagery (131 bands) | 30m | 4 days |
| Sentinel-3 | To measure sea surface topography, sea and land surface temperature, and ocean and land surface colour to support ocean forecasting systems, environmental and climate monitoring. | Four main sensors:
– OLCI – SLSTR – SRAL – MWR |
300m
500m 1000m |
<2 days |
| Sentinel-4 | To monitor key air quality, trace gases and aerosols over Europe at high spatial resolution and with a fast revisit time. | Multispectral imagery (3 bands) | 8000m | 1 hour |
| Sentinel-5
Sentinel-5P |
To provide atmospheric measurements and climate monitoring, relating to air quality, ozone and UV radiation. | Two sensors:
– Multispectral imagery (7 bands) – TROPOspheric Monitoring Instrument (4 bands) |
7500m
50,000m |
Daily |
| Sentinel-6 | To provide enhanced continuity to the mean sea level time-series measurements and ocean sea state that started in 1992 with previous missions. | Three sensors:
– Synthetic Aperture Radar (SAR) – Advanced Microwave Radiometer – High Resolution Microwave Radiometer |
300m | 10 days |
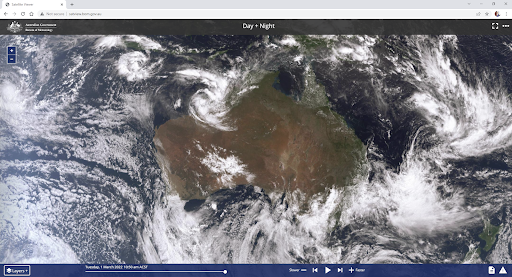
The Himawari satellite viewer (link) provides a continental scale animation of weather systems. Cyclone Anika is shown crossing the Western Australia Kimberley region.
Remote sensing and Earth Observation is a whole world (sorry, pun intended) of specialised science and data unto itself. There is so much research out there, but also some practical analysis and visualisation tools to help people in the environment space apply these resources to real-world applications. I must admit the more I dig into different satellite platform websites and their data products, the more I discover that could be valuable. I hope I’ve been able to give people a sense of the potential out there, and we’ll also think about building some of this content into a QGIS training module in the near future.
Contact us via email or start a conversation with us on one of our social media platforms – Twitter, LinkedIn or Facebook.
Chris
Comments are closed.