A week ago, AJ tasked me with running a code sprint. Working as a team, Akeal, Aaron and I had to write something that
- Used the Python programming language – leveraging Akeal’s professional development project,
- Used the Gaia Resources Bird Database – based on the Biological Data Recording System (BDRS), and
- Involved spatial analysis.
No matter what we chose to do, we had to complete the sprint in 1 working day. Challenge accepted!
With some consultation with Piers and AJ, I decided that we would create a reporting framework for the BDRS. It was going to be a technically challenging task. We had to find a way to communicate between Python and Java, perform spatial analysis and generate reports. Three tasks for three people. I tackled the task of passing data between Python and Java.
At first it seemed obvious, why not use Jython? Jython is an implementation of the Python programming language designed to run on the Java platform. If Jython is supposed to work with Java and the BDRS is implemented in Java then integrating the two components together should be easy. As it turned out, that was indeed the easy part. Less obvious however, was how I was going to provide spatial analysis capabilities in Jython. Most spatial libraries such as GDAL and Shapely have a Python component, however, they also have a C component. Typically these components handle the computationally intensive tasks which happen to constitute almost everything about spatial analysis. Simply put it was like fitting a square peg into a round hole – they were never going to work together. Then I discovered Jepp.
Jepp embeds CPython (the default and most widely used implementation) in Java. I’ll admit that I was dubious. Jepp simply didn’t seem to have the level of documentation or user community to give me that reassuring feeling. Still, I had nothing to lose. I tried it out and much to my surprise it simply worked. It didn’t have much documentation because you simply don’t need it. I tried installing Shapely and it worked right away without any errors. We had a winner.
Akeal tackled the task of spatially analysing the Gaia Resources bird sightings, and this is what he went through:
Akeal: I had just returned from a week-off when I discovered that I was going to be participating in a code sprint – what the heck is a code sprint? I had never used Shapely before, and now I was being asked to work at the same pace as the Developers – all within a day!
So after getting myself stressed out, I decided to get Ben’s help in giving me a push-start in. Once that was done, I was a lot more comfortable sitting with the Developers. At 3:40pm I realised I was running out of time, fast, and made an exclamation to that effect! Luckily, the others had overheard me and told me it was still 2 hours earlier than I thought. Reason? The laptop the guys set me up on had Eastern states time. That’s all I’m going to say about that…
After I was once again comforted (my nerves had taken quite a battering!), I began to enjoy my coding session. My part involved reading in a series of latitude / longitude coordinates representing occurences of a species, then finding the convex hull coordinates for the distribution, and returning the coordinates that make up the convex hull. I used the open source Python module ‘Shapely’ which has many more great features.
Aaron worked on the reporting framework, and his comments are below:
Aaron: I was responsible for putting together the reporting framework on the Python side. This involved using the bridge between Java / Python that Ben developed, providing a user interface and integrating Akeal’s spatial analysis work into the report.
The first step was getting the marshalling between Python / Java working properly. This had a few hiccups and used more time than we had planned for. Next we had to make a web page to show the user. For our templating engine we used Cheetah. Cheetah is based on Velocity which is already used in the BDRS hence it was a logical choice. Finally I had to use the API provided by Akeal and Ben. Get some data from the BDRS, process it using Shapeley and then using the Google static map API, draw a map!
The three of us started the day with the goal of creating 4 reports. However, as 1 pm came and went, we hadn’t yet produce a single report. This was serious! It was time to start cutting features. We decided to drop 3 reports and to redeploy Aaron and Akeal. Akeal would continue with the spatial analysis while Aaron would focus on integrating the spatial analysis part with the browser and BDRS.
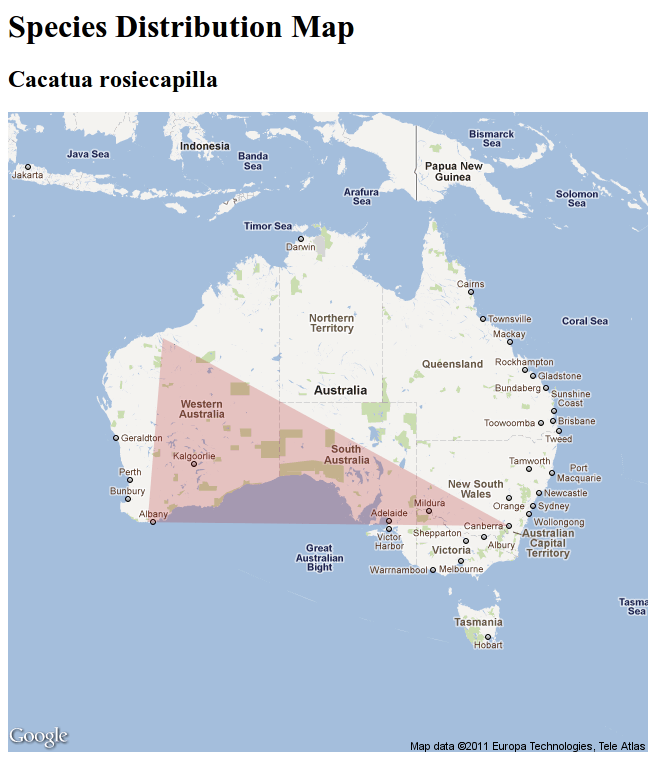
It took us right up to the last minute, and perhaps a little more, but we did it. Below is a Google Static Map showing the Occurrence Map of the Cacatua rosiecapilla, based on the records we have in our version of the BDRS – so obviously not an exhaustive series of points to use, but it proves that it can be done.
It was a long day and there were some stressful moments but I think we all learned a lot from this experience. We learned that:
- Ben: When you cannot meet a deadline consider dropping features. In our final presentation to Piers and AJ, they didn’t realise we had originally planned for many more reports.
- Aaron: I am a novice with Python and through this code sprint I learnt a some important points. Code sprints are a great way to develop mental agility and small team coordination.
- Akeal: Working across teams is great! The Spatial and Development teams need to work together more, and it would be great if we can keep finding more opportunities to do this.
The saddest part of this code sprint was that we were only demonstrating that integrating Python and Java to create a reporting framework was possible. We didn’t plan on creating robust and maintainable software and our code showed ample evidence of this. So it was now time to retire our little experiment, store the code in a branch of source control and continue with our usual engineering process.
Ben
Comments are closed.