We’ve been working with the State Records Office of Western Australia for a few years now on their archives system (see our post here for more details).
These online collections range from historic hand drawn maps to diary entries written across the trips of many explorers. So, given that some of us are pretty keen on maps, we have been looking for a project to use some of these maps and to see what we can do with them. I thought I’d start by taking some of the Perth metropolitan town site maps, dating back to 1966 (*).
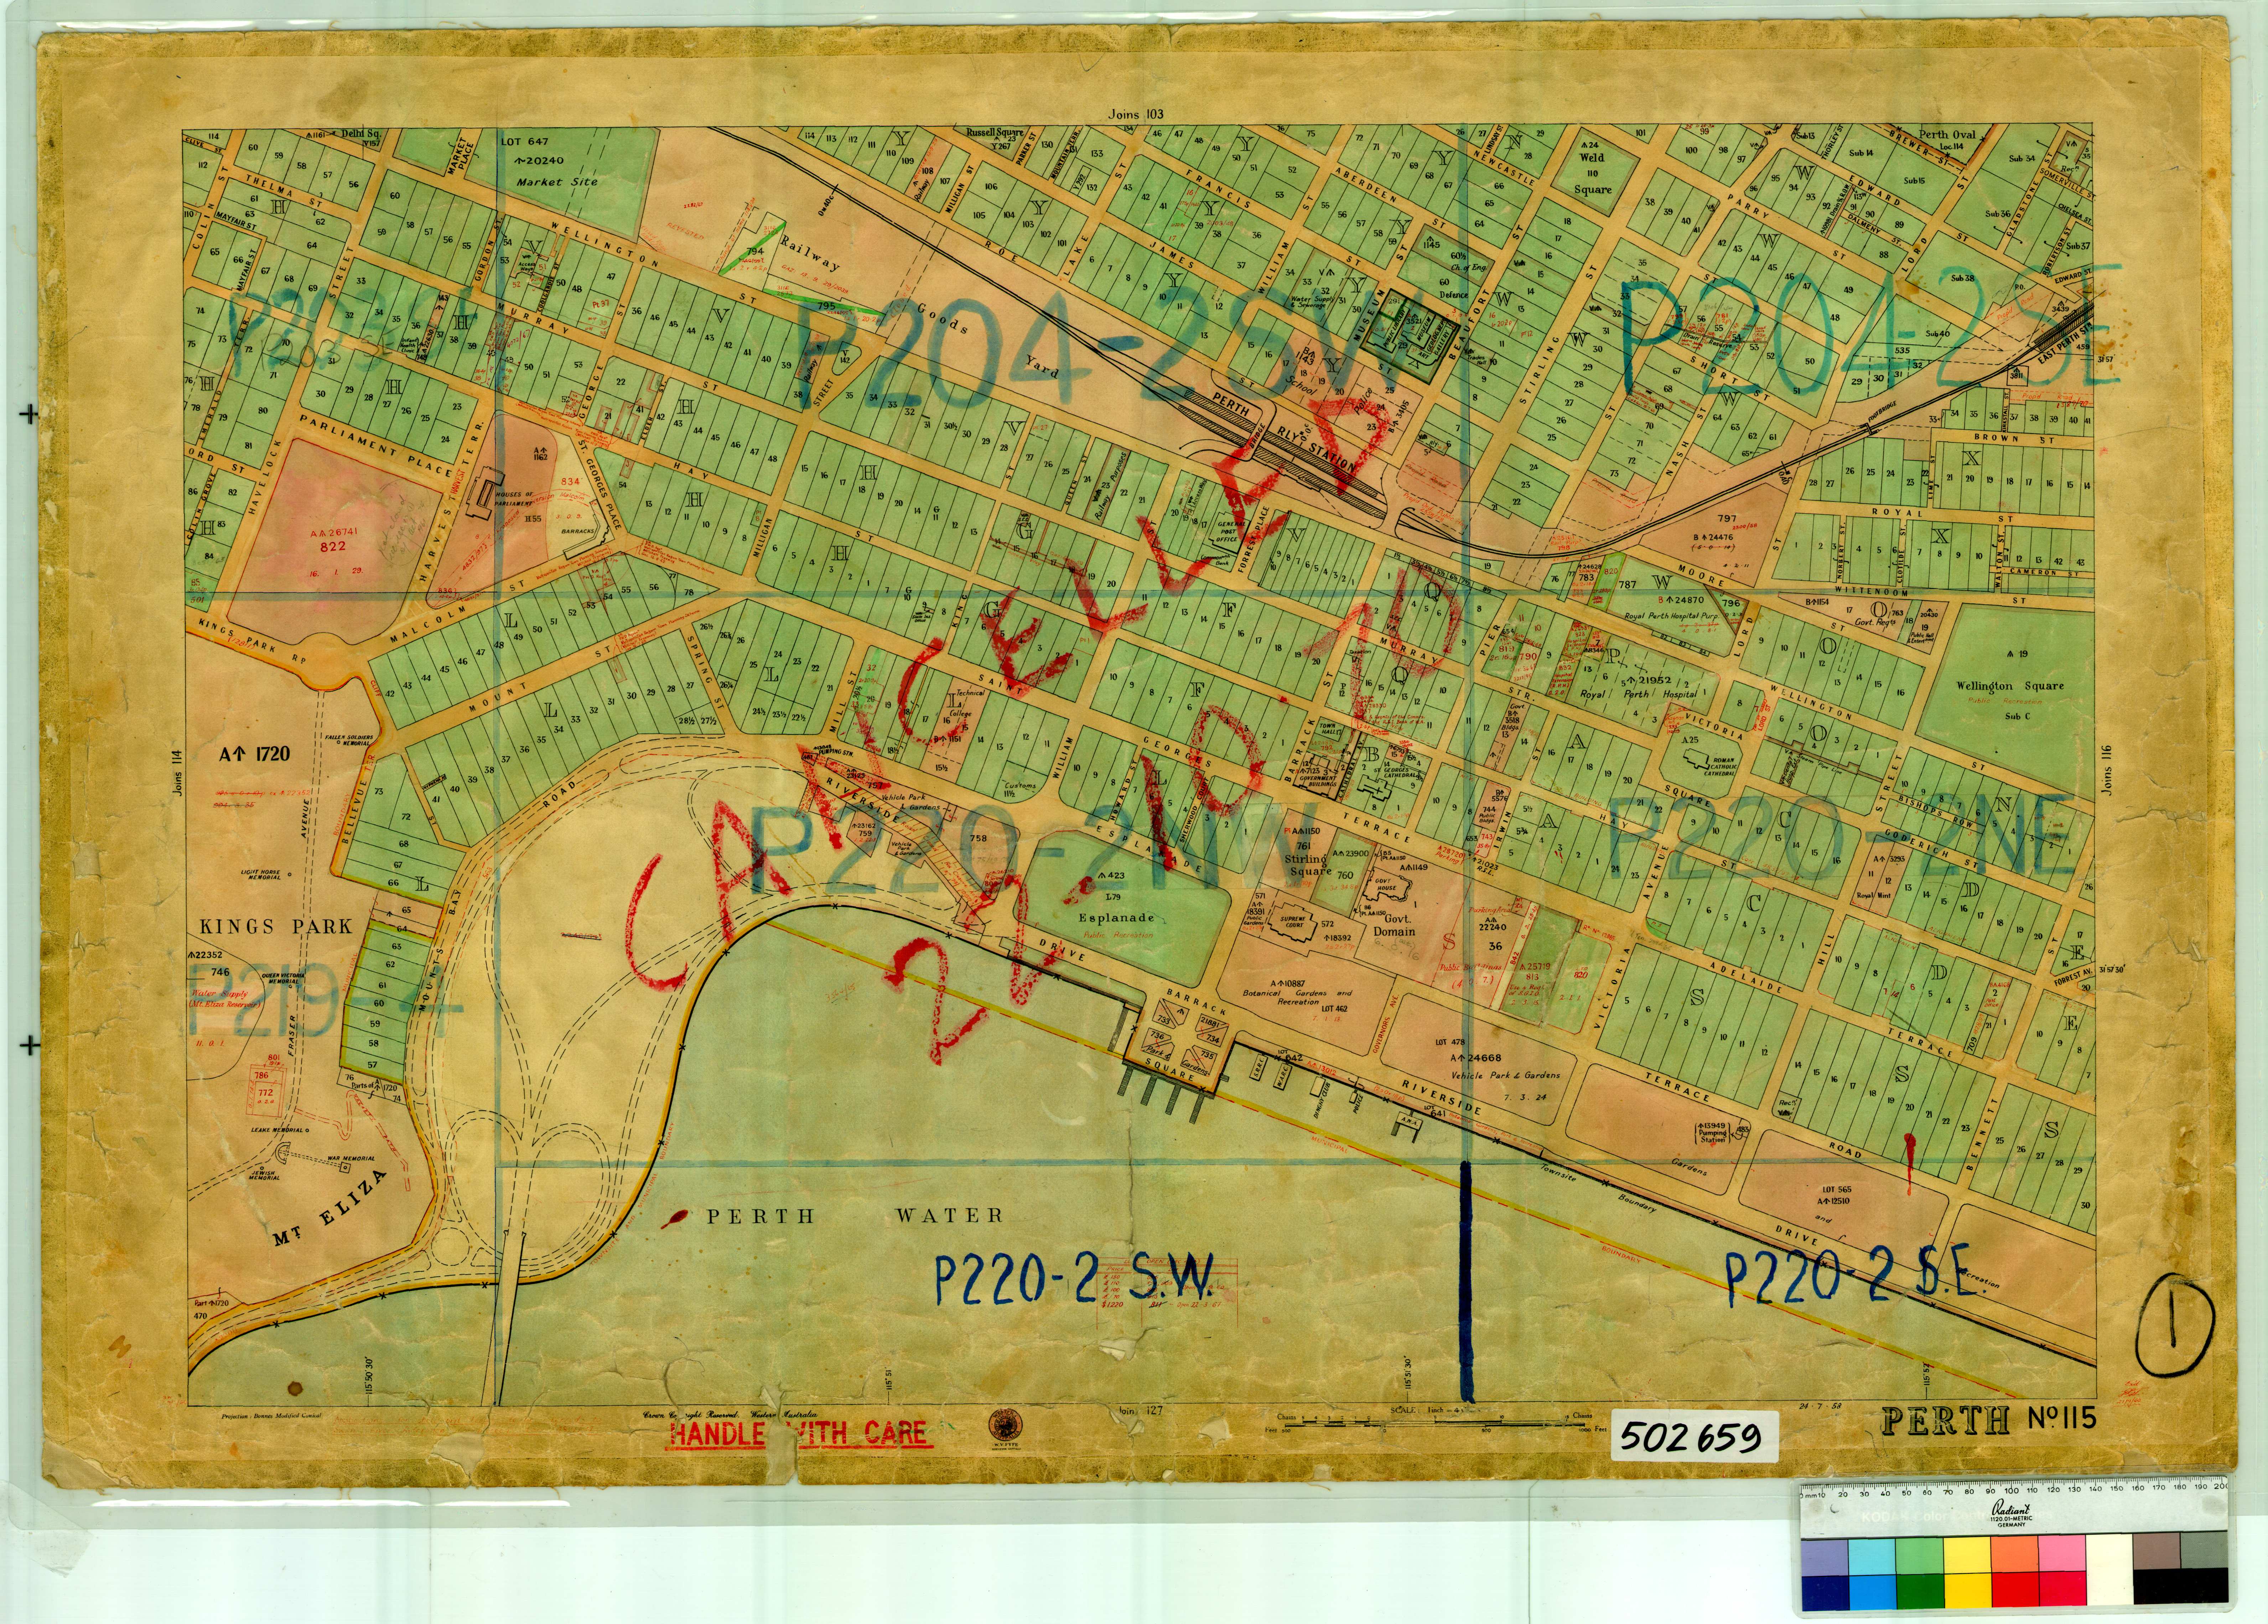
Credit: State Records Office of Western Australia
There are numerous ways in which you could use these maps, but the first step was to catalogue and georeference the 33 town site maps I started with. For those non-savvy GIS people this involves assigning “real-world” coordinates to a correlated spread of points on an image (in this case, the town site maps). To find these these coordinates, I used Open Street Map roads, pipelines, and reserves, and to get the data onto my desktop, I used MapZen, where the Perth Metro area is readily available to download in multiple formats.
The 33 town sites cover most of the central and west metropolitan area of Perth (with a single one down near Fremantle). As I was zooming into the maps my interest grew as I was finding significant differences and I started to speculate about what’s changed in that area. From a first glance up close the first thing that comes to mind is the substantial increase in major infrastructure. The majority of minor roads have not changed, but certainly a new freeway and railway line shows up very nicely – have a look around our office in Leederville to see what that area looked like before there was a Freeway!
This was all sitting in my desktop tools, and we wanted to go a step further than just having a bunch of images that only we could see. So, with some support from Andrew and Serge, I loaded the images into our own GRID instance (we run one where we can play ourselves) and then used the features in GRID to turn this into a public Web Mapping Service. Then we used the WordPress Leaflet plugin we’ve developed for GRID (and which we use in places like the Pilbara Corridors site) to make these maps available through the map below.
This is just a starting point. The ways in which you could use these maps are extensive, and with many more regional town site maps catalogued in the SRO database this project could extend outwards:
- Overlaying road, rail, and transport layers (there is a transport layer included in web map, give it a try!).
- Overlaying 3D buildings
- Graphic presentations and visuals
- Feature extraction and encoding
- Vectorise historical data into numerous features such as; anthropogenic features (roads, buildings, places, place names), natural features (rivers, lakes, parks, reserves), suburb information, parcel/property boundaries, built up areas and all sorts of other datasets, and
- You could even take this vector data and do some analytical processing to evaluate things such as land use or land cover changes.
It has been great to have some time to take the resources that the State Records Office are making freely available and to do some professional development with. While I already knew how to take images and georeference them, to do this and then expand my knowledge of our other products, like GRID and our WordPress Leaflet plugin, has been a great way to learn about a few new tools.
If you want to know more, drop me an email, or start a conversation with us on Facebook, Twitter or LinkedIn.
Jake
* Piers’ note: 1966 isn’t that old you young whipper snapper!
Love to see you put on some of the really old maps. And they could be used be genealogists everywhere. What a resource!
It’s something we were thinking about as well! Thanks for the encouragement, Carole.