We have a guest blog post this week from Linda Nguyen, Linda is the 2012 recipient of our Curtin University Spatial Sciences Scholarship and has been working with us for the last two weeks mapping trees around the local Leederville area. Linda is sharing her experiences on the project and some truly awful tree jokes.
Tree Mapping – Linda Nguyen
Over the last two weeks of my uni break, I was given the privilege of coming into the Gaia office and working on an exciting individual project with the mentoring of the lovely Mel. The project involved testing the Biological Data Recording System (BDRS) mobile application on a Samsung Galaxy tablet and analysing different types of trees around the area of Leederville. This gave me the opportunity to source any errors and issues with the BDRS and to also learn how to produce a variety of map outputs.
I gained a lot of practical experience and learnt about the applications of GIS, particularly within the local environment. So over the past two weeks, I actually got myself involved in testing the mobile device, which was really exciting to try out. During the first week, I worked my way slowly around the streets of Leederville, collecting data and going back to the office to extract and check the data, and then adjusting fields within the survey to my liking. I added extra fields into the BDRS survey so that the data had the possibility to be used in a variety of ways, such as searching for bat hollows within trees to assist Grit in her Bat Survey (however this wasn’t very useful, as I only found ONE bat hollow out of the sixty six trees!!). As I gained more experience, the task of data collection and data checking became a lot easier and more repetitive, and I was quickly learning how to complete these tasks efficiently and at a much faster pace. After three days of data collection, I was proud and slightly surprised that I already had over 65 records uploaded onto the server! I discovered so many different species that I never knew existed, and my mind was overwhelmed by an overload of tree information. It was such a re-leaf (haha) to get back into the office and learn some mapping work.
Of course, along the way I came across a FEW errors and issues (seemed to get Piers really excited!!), which were recorded into a table, and with the help of Kehan and AJ, we eventually got to the root of some problems and solved them. I learnt the importance of breaking and looking for bugs and errors, and it was beneficial that I had never seen nor heard of the BDRS application before, and hence it was a lot easier for me to find small errors and issues.
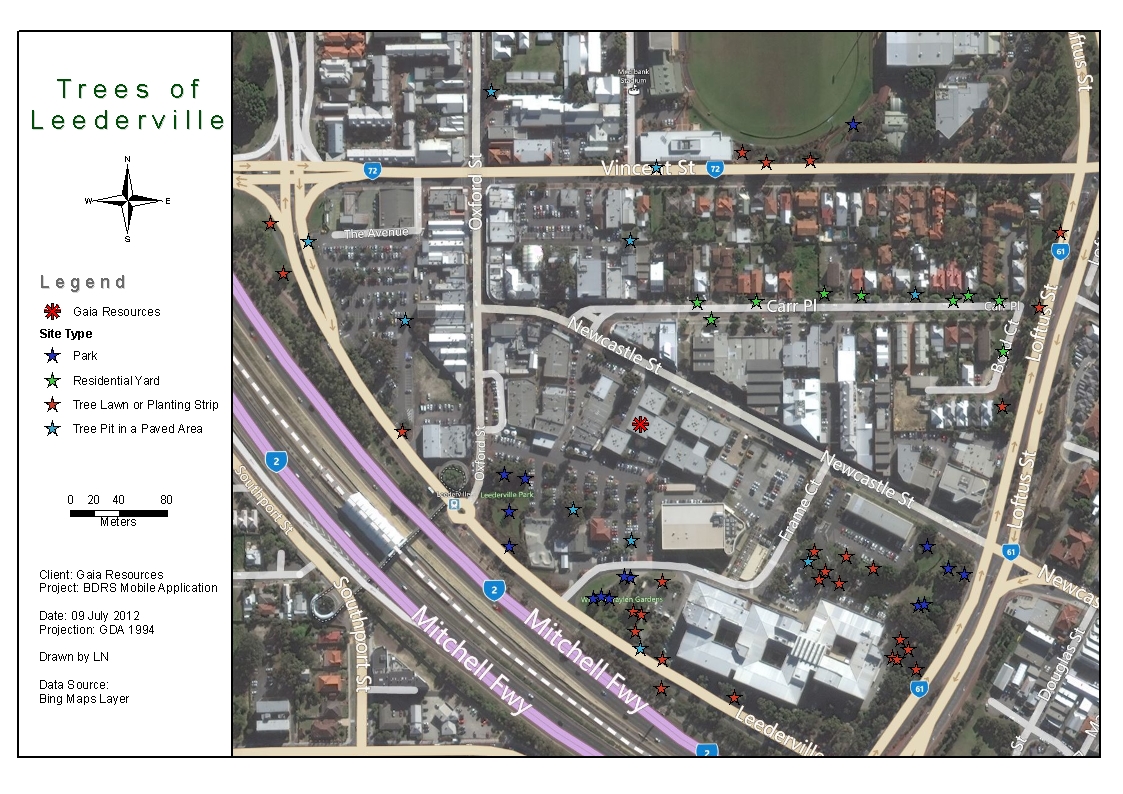
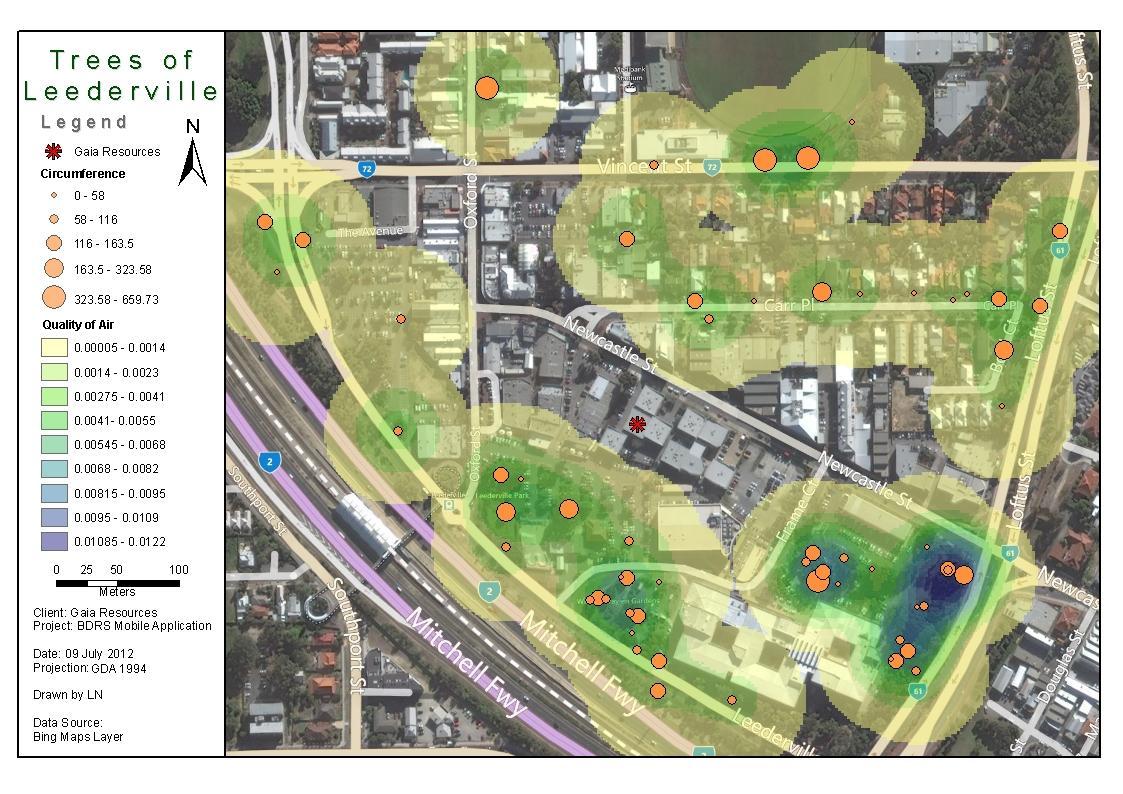
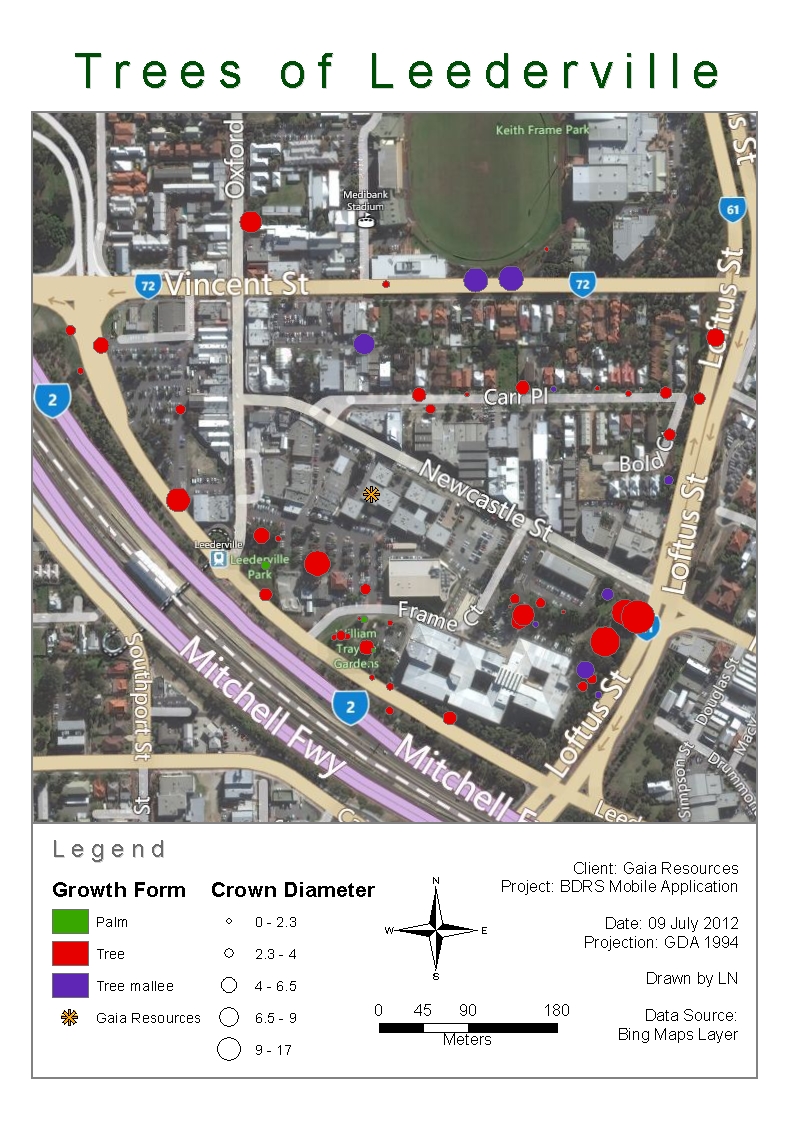
With the generous help of Mel, I produced a couple of map outputs displaying the data that I had collected throughout the week. I firstly learnt the arduous task of creating metadata, which I found was quite tedious having to list all the details for each and every attribute, however I knew it was a vital step in producing accurate and practical results. Then I learnt how to complete a simple analysis of the data I had collected, through the careful manipulation of different tools on ArcGIS such as buffering and density tools, in order to produce certain outcomes. And so, I went out on a limb and produced a range of different maps, a few are shown below.
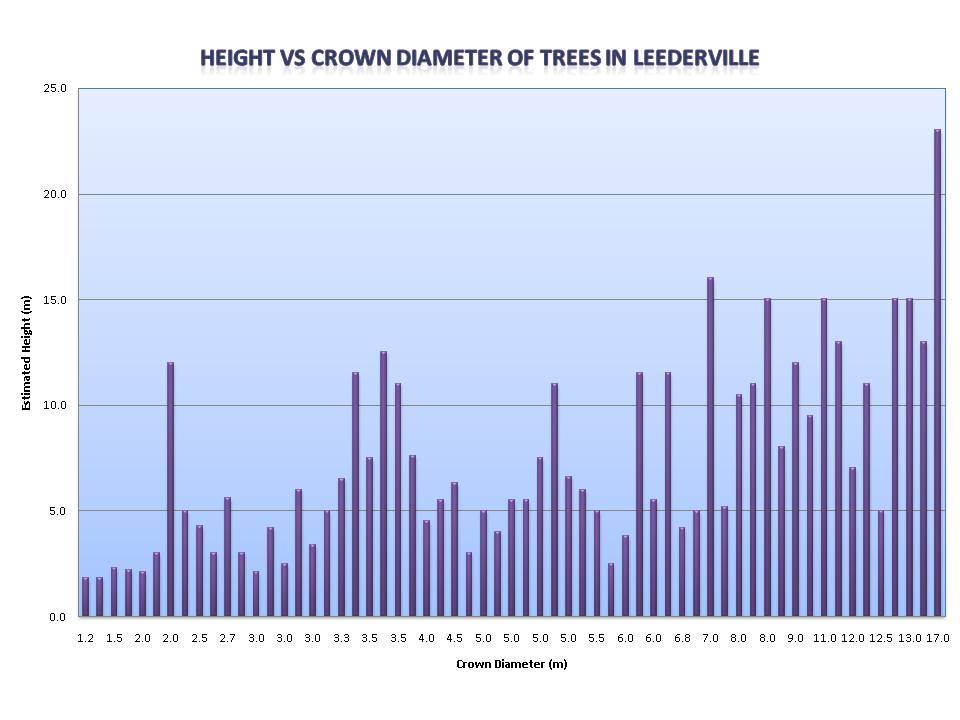
Mel also helped me branch out my skills by teaching me how to use Microsoft Excel in order to produce charts and maps using data imported from the attributes table in ArcGIS, which I found extremely helpful, especially considering the fact that I had never used Excel before.
In conclusion, I thoroughly enjoyed my two weeks here at Gaia, and despite the short time I gained a myriad of skills that I can take back to uni and utilise for my own learning. Completing fieldwork and getting involved was really.. in-tree-ging. And I learnt the importance of planning and thinking carefully about map outputs before going out to the field. I also became more aware of the importance of the type of information I had to collect and I gained a greater understanding of the different tree species. Everyone was extremely helpful and friendly, (I don’t mean to be sappy) and were willing to help me with my project, which made it a lot easier for me. Engaging in meetings and fun Thursday afternoon routines made me feel part of the team was definitely a great experience. Though I had time limits and restricted sources of data, I am really happy with what I have produced and all the experiences I have gained.

Comments are closed.