We’ve been running three different internal citizen science projects over the past year, and I thought that the start of the year is a good time to do a bit of reflection on them.
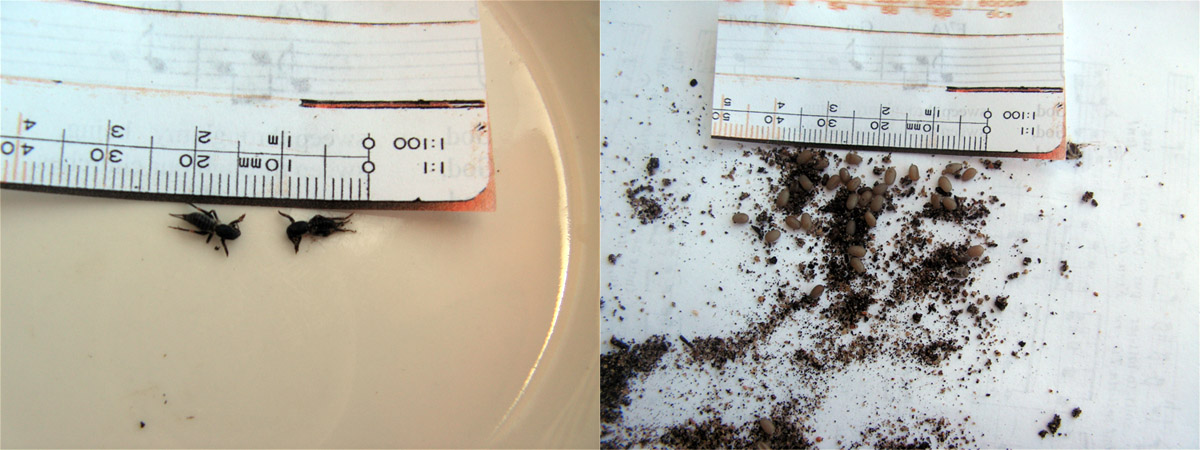
Mole Crickets
This is our most widely publicised citizen science activity (even getting a mention in Science Network WA), possibly because it seems a little bit strange to most people. I wrote about this in my start of the new year post as a highlight for 2013, but I thought it was worth looking at a few things we found out along the way, such as:
- The Australian distribution – we have sightings from around the Swan Coastal Plan (down to Bunbury), from Adelaide (thanks to @mickroz71) and Tasmania (thanks to @RockyCape1). Many of these are confirmed with photographic evidence (such as the very interesting photo of new hatchlings and eggs provided by Bevan from Mandurah), but we have a lot of work to do filling in the blanks though!
- The confirmation that “mole cricket” is a common name for a number of species. The mentions in the US have indicated to me they are talking about a very different type of cricket.
- Engagement is key. I did a specific experiment around the mole cricket survey in 2013 that really highlights that when engagement drops off, so do records. This little experiment we’ve re-run again (see Coffee) and this does ring very true – so once again in 2014 we’ll be asking our clients “what is your engagement strategy?” for every citizen science project!
Where to next for the mole crickets? Well, we’ve been a bit quiet on this one while we catch up over the new year break, but we’re looking again at this and will be discussing it with colleagues in research institutions to see if we can come up with some research around this, and to get some clearer identification of the species.
I personally have been looking at seeing if we can roll this out as some sort of a classroom project, in conjunction with a competition like the Spatial Technology in Schools initiative – so far, I just haven’t had the time to take this any further, but there’s all of 2014 in front of us…
Coffee
Our biggest vice in the office is caffeinated beverages, and so we started the Coffee Survey in November 2012 to get our team using the BDRS and new apps we were developing. This is a good way to test your own software!
The coffee survey now has 550 records in it – a lot fewer than the coffee’s we’ve drunk in that time – but that participation has been all about engagement as well. When we don’t promote it or remind people, it doesn’t get added to. I’ll gloss over the fact I personally have recorded 271 of those 550 records…
We even used this data in a sprint with CSIRO to pass data from the BDRS to look at the density of records using the Google Maps API and the D3 visualisation library, so we get to have a bit of #geogeekery in here too.
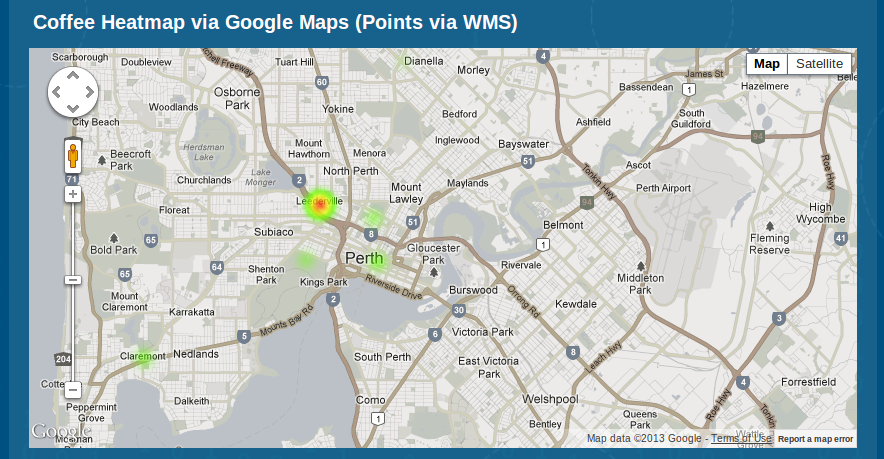
Sayers in Leederville gets the most records (183) and on average their coffee gets rated a 7.6 out of 10. In terms of number of recods, Duende comes in second with 67 coffees with an average of 6.8. The prevalence of these two is not unsurprising since our office is just over the road from there!
In late 2013, when we got really busy – and the coffee really started to flow – we somehow forgot about the survey, and records dropped off dramatically. I know that even today, when I wandered past Cranked and grabbed a coffee this morning, I forgot to add it in – so I’m just adding in our 551st record, and will start reminding our team to get back into it next week.
We only started to add in price to the survey later, but one of the things I’d like to do is to attempt to find not only the best coffee in Perth, but at the end of the year we can work out the best coffee for the price – and work out how much we all spent on coffee (which will be terrifying).
Bats
Our final team effort is the ongoing bat survey we are doing. We wrote about this back in 2012 where we posted some preliminary results.
Since then we’ve been continuing to take the unit home, like I did last night, and placed out as shown below – please ignore my horribly patchy lawn, but that’s what a 40degC+ weekend will do.
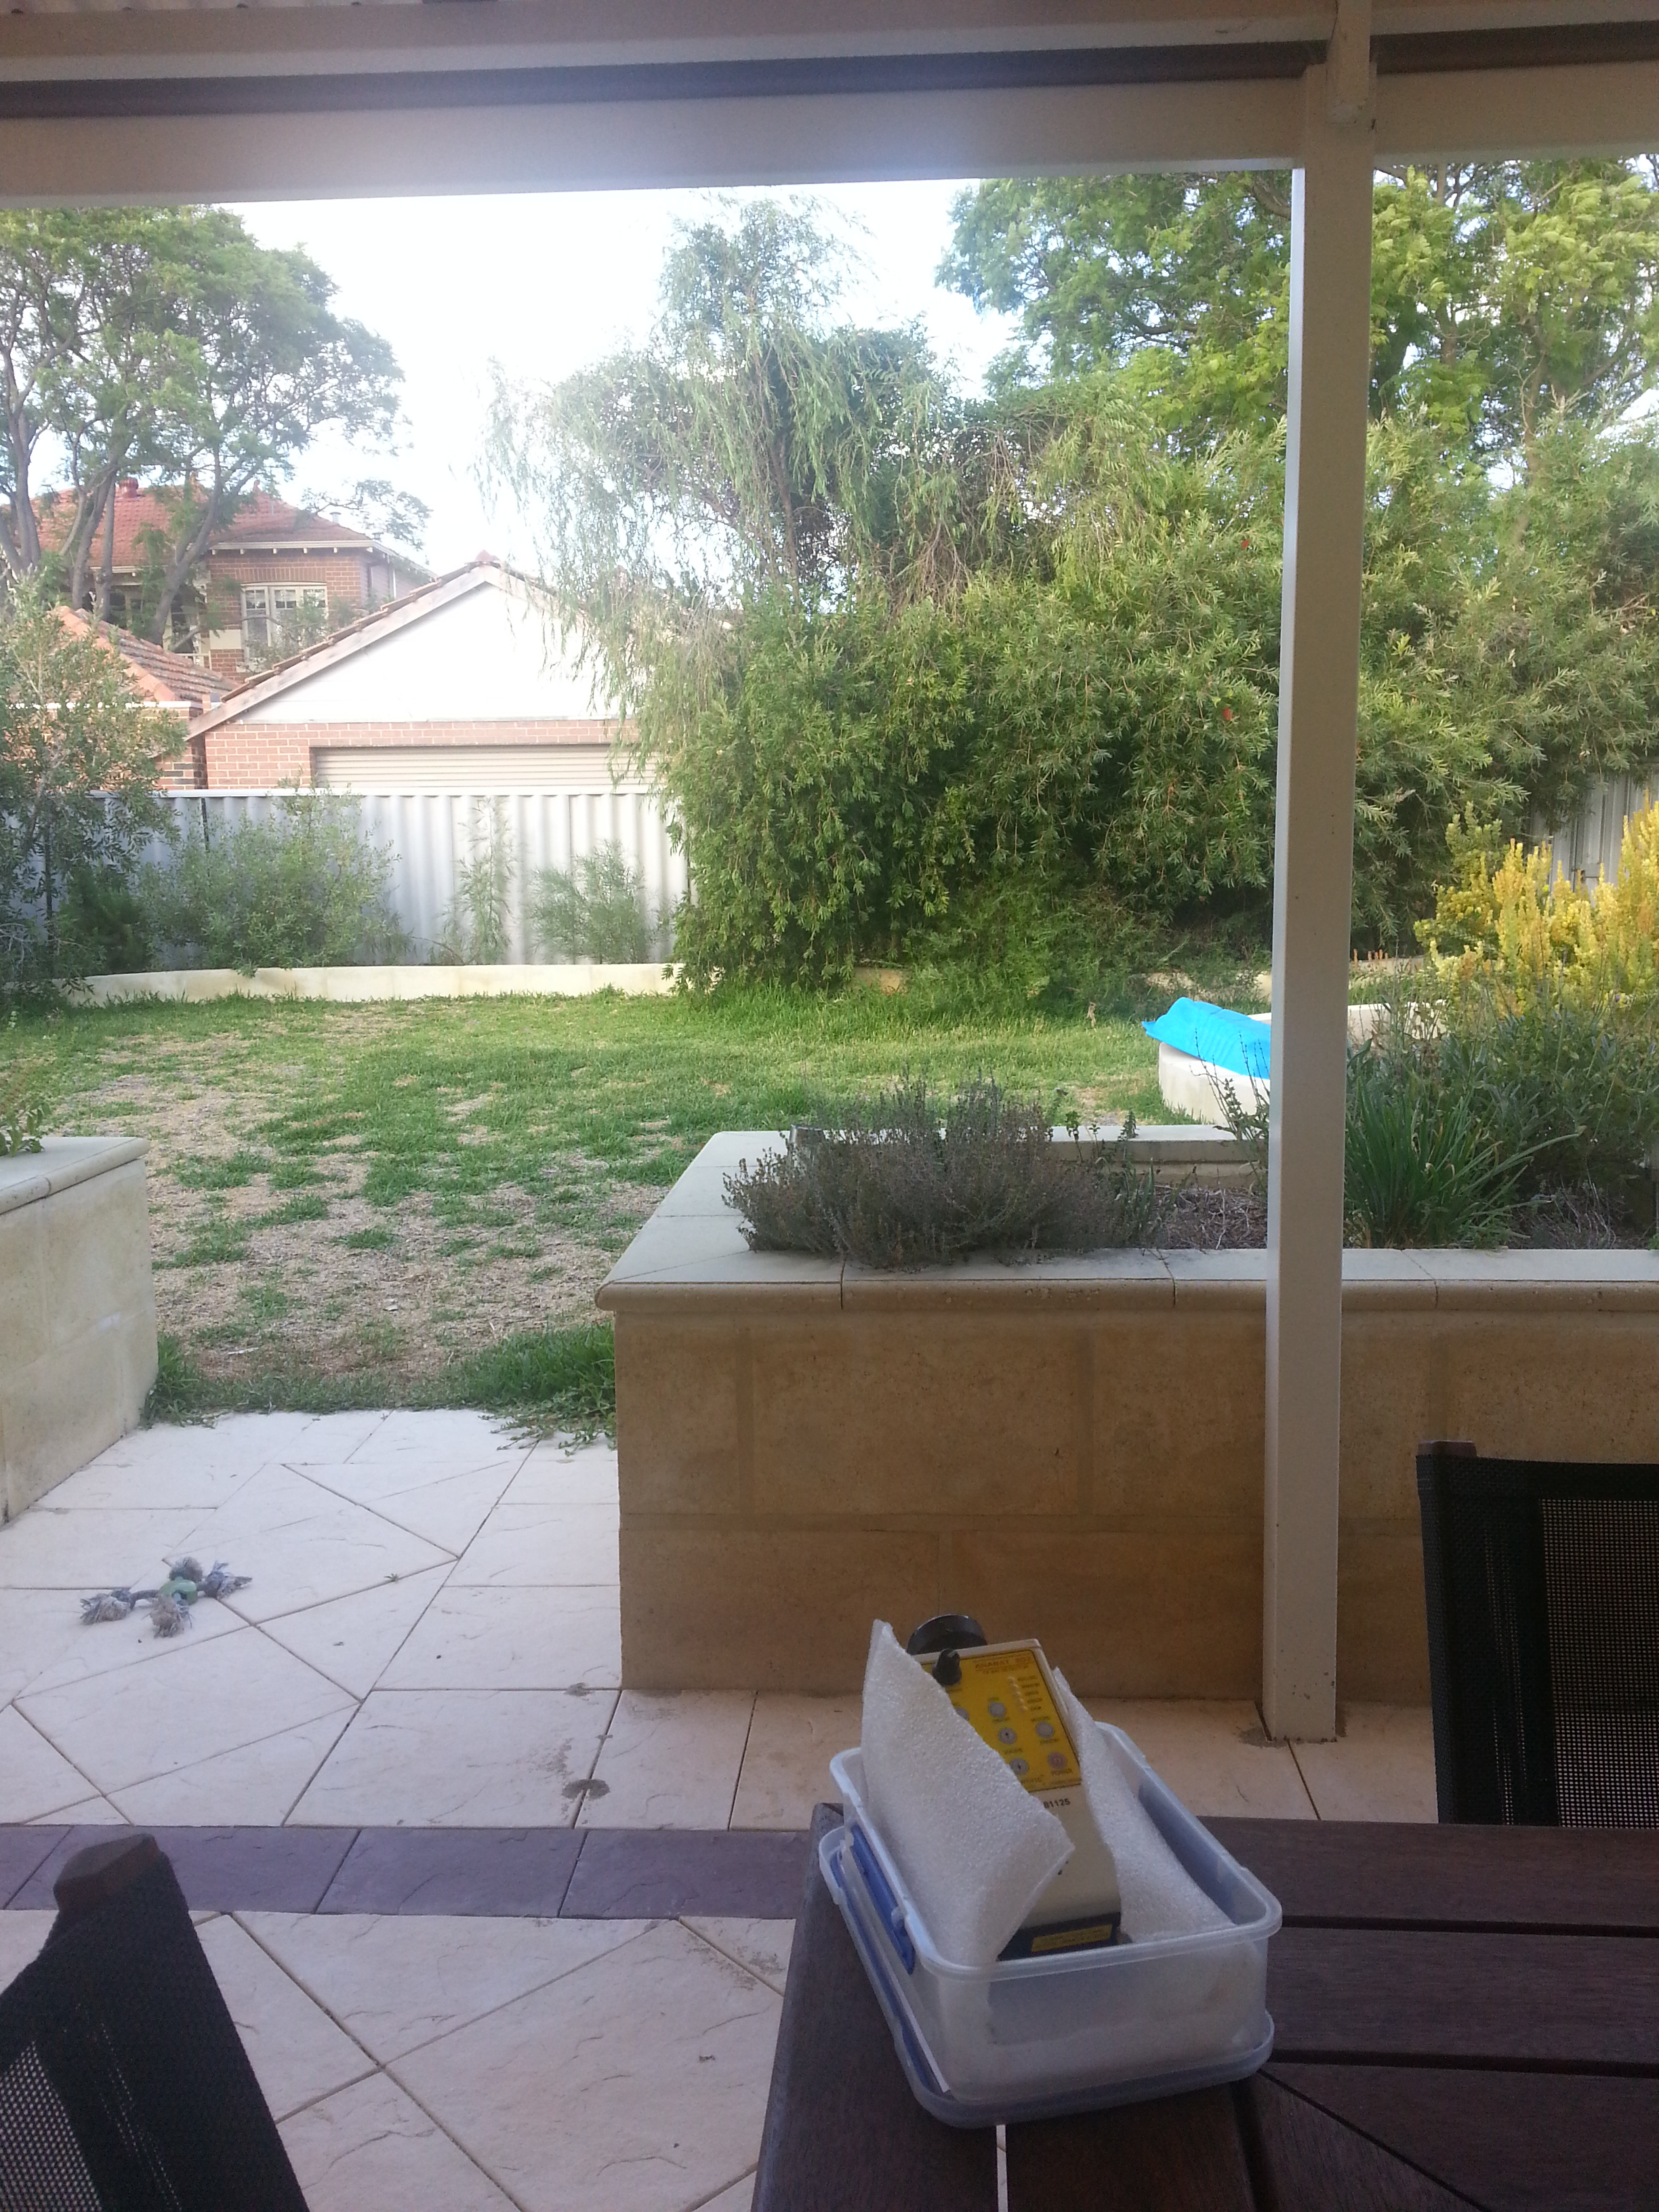
The bat survey now has records from over 40 locations, including places around Perth (that’s our team’s homes), and from when people have taken the unit on camping trips to the south-west, and when we’ve done field trips to the Pilbara, Bunbury, Albany, South Australia and New South Wales. So we have a quite large number of calls from a variety of species.
At the moment, Debbie and I are working hard to stocktake this project, and work out what sort of help we need with some of the identifications that we have been struggling with. We also are having a bit of fun with the changing taxonomy of bats – looking at the Mormopterus genus as an example.
We are still taking this unit home with us each night, and hoping that our aging Anabat SD2 unit can make it through another year…
Other things and next steps
A few of us also have a few other citizen science style projects or test cases that we are looking at, depending on our own interests. As examples:
- Mel used the BDRS and the app to look at finding art spaces around Perth where she could do her artwork that has included murals commissioned in a few places around Perth,
- Kehan has done some stuff that is plant related, on a tree survey and a more specific Perth plant survey, which have been on hold while he’s been out at the Museum for so long,
- AJ, as a Team Lead for the State Emergency Service, has been logging his incident callouts in the BDRS to test some functionality and to help him keep records, and
- I have been continuing to record birds as well – I have personally recorded 15,377 records of birds in the BDRS, which includes 3,574 during 2013 (or just shy of 10 a day). When I tally up the individual numbers of birds I’ve seen, that adds up to 54,725 birds…
From here, our three main surveys will be reviewed over the coming weeks as we come back up to speed and take stock of where we are at. There is a lot of data in our own BDRS now, and it’s starting to get to the point where we can start to really ask some interesting questions of the data within it… and this sort of internal use of our software really helps with our commercial work, like Coastal Walkabout.
Stay tuned for more updates on our citizen science projects throughout 2014!
Piers
Comments are closed.