In Western Australia the Polyphagus shot-hole borer (PSHB, Euwallacea fornicatus) has been a major biosecurity problem since it was detected in Perth in 2021. This week, the State government announced that it was no longer deemed possible to eradicate this pest, and instead a management approach to try to slow the spread of the pest is in play.
We were discussing in an internal Gaia Resources chat about this rather sad outcome, and so yesterday we asked - OK, so how would we look at this, and what is the spread going to be like, and what can we do to help?
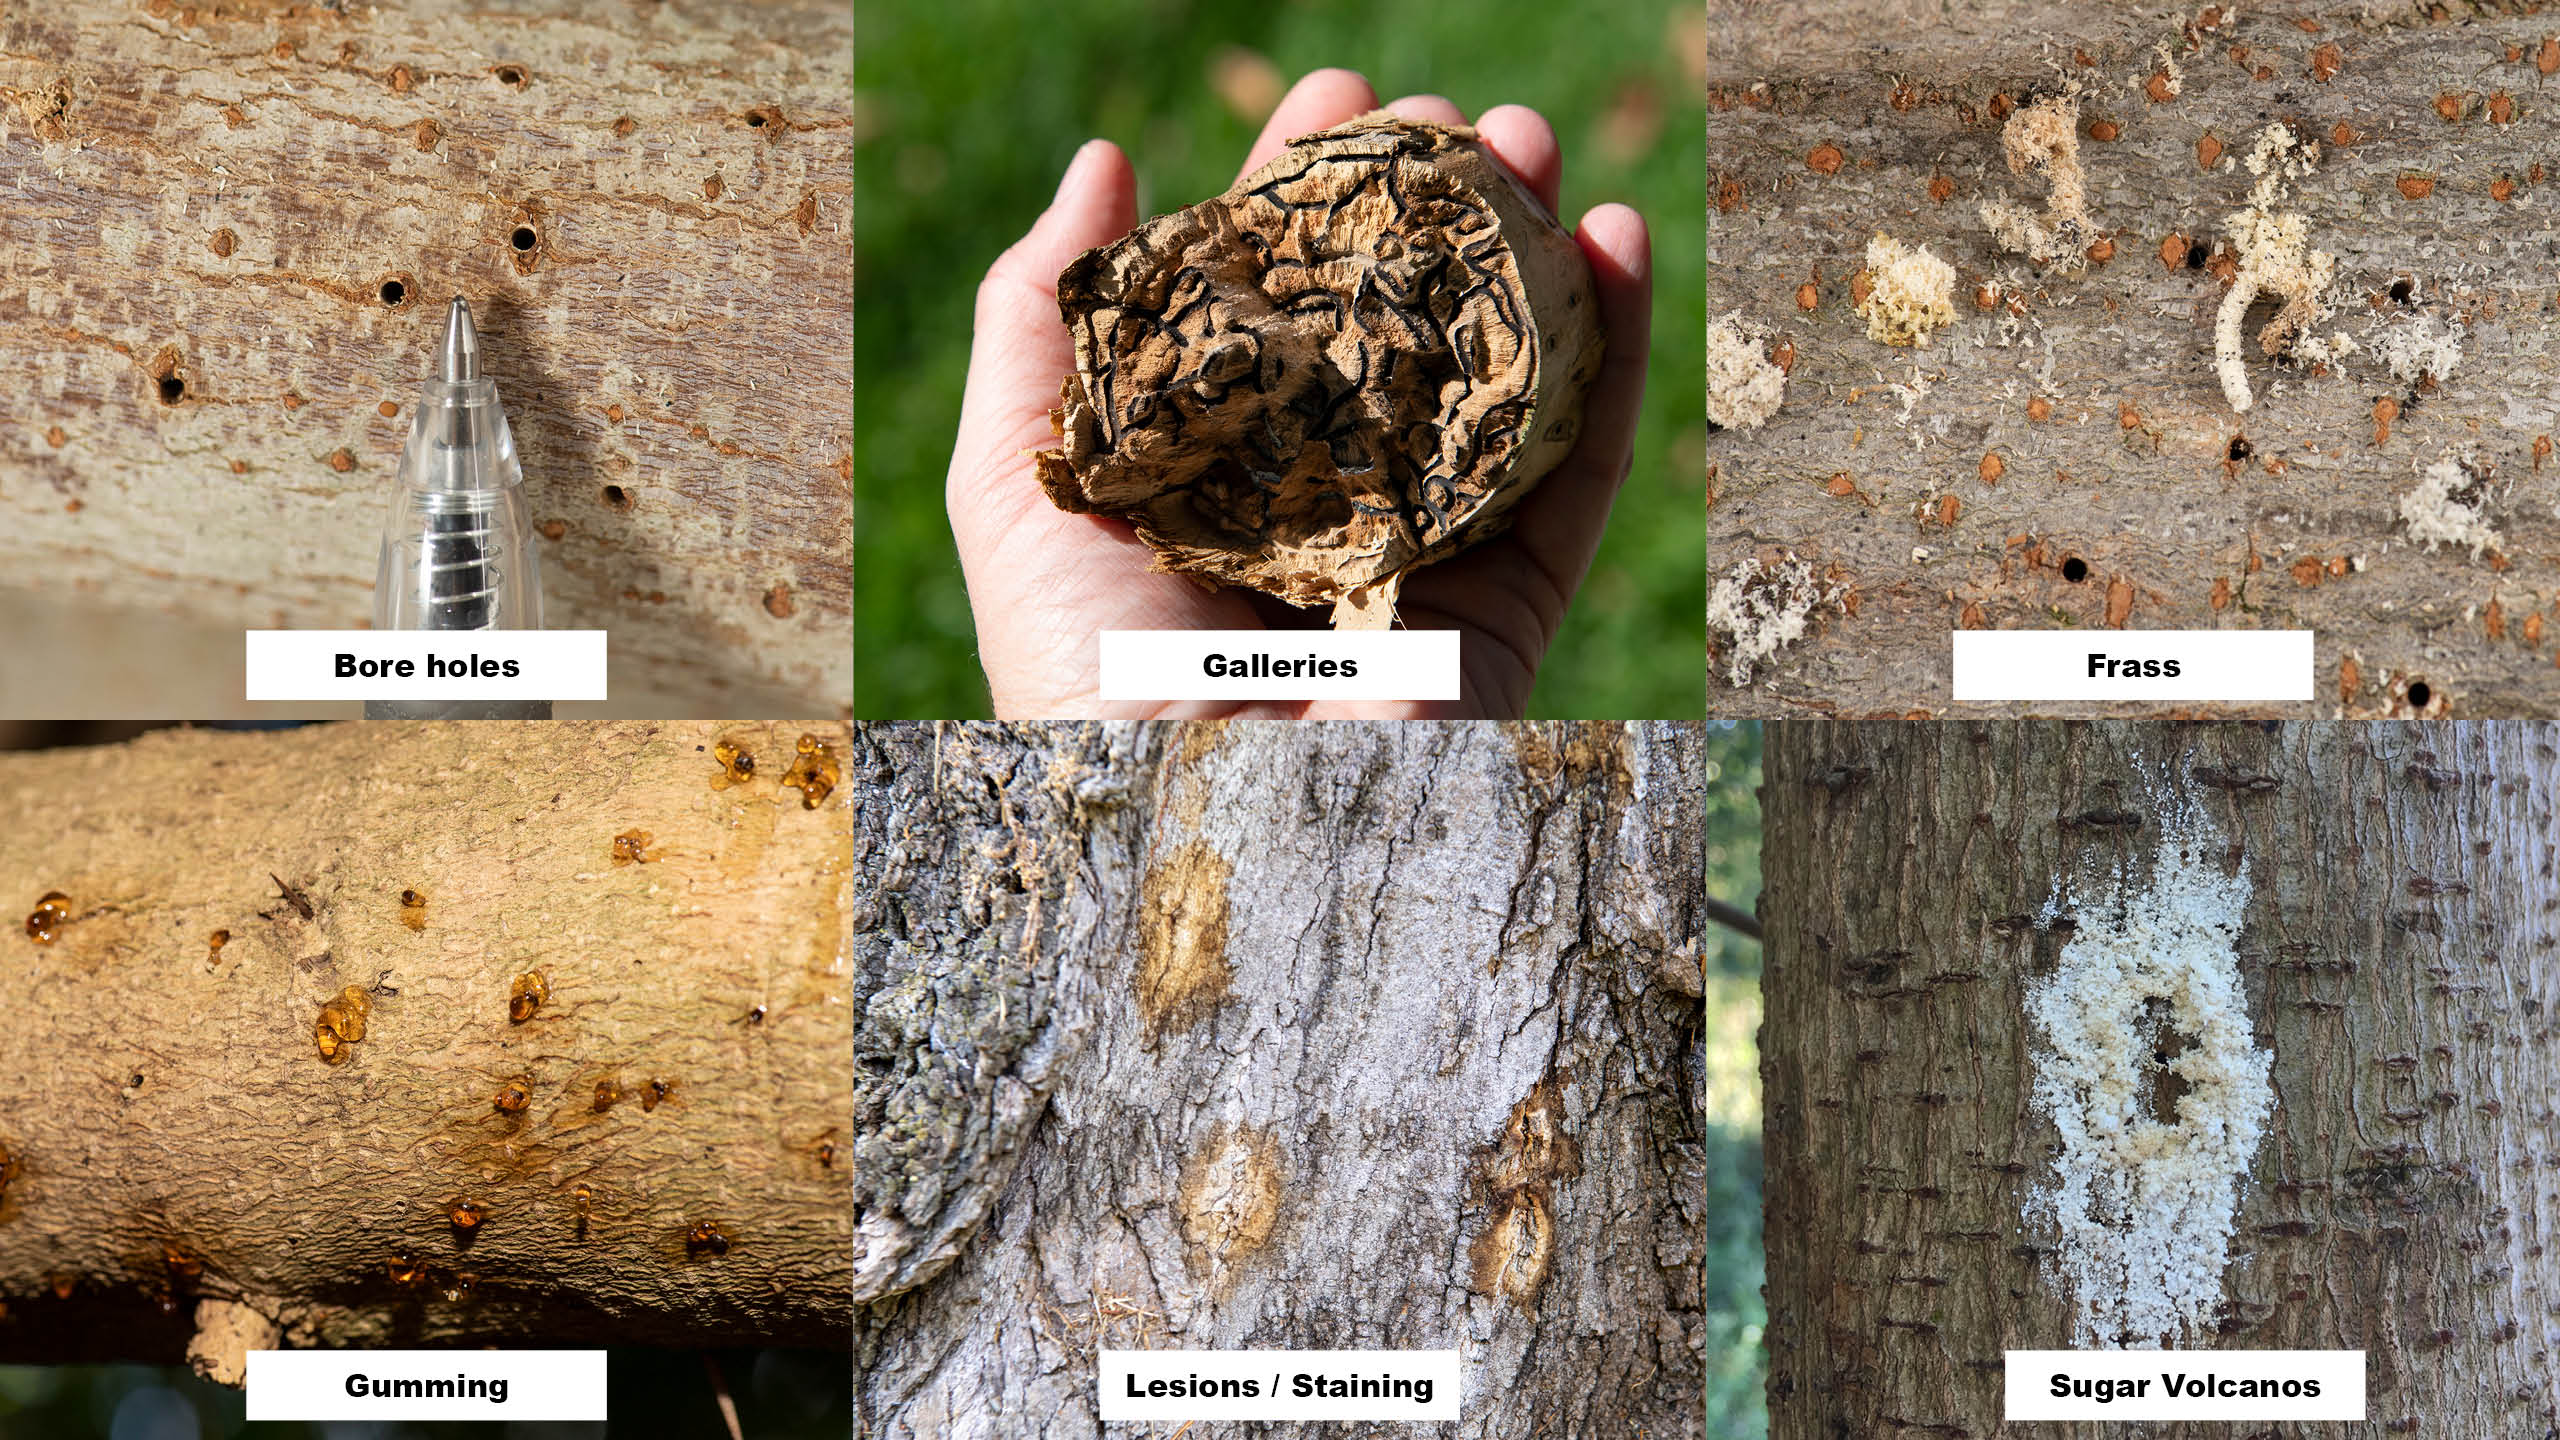
The first thing that we were looking for was information about how to identify it and report it, so we can be better informed. There’s a few resources around and our Department of Primary Industries and Regional Development (DPIRD, who look after agriculture and pests here) have a few images on their web site and a link to their MyPestGuide® Reporter app to report sightings. This is a citizen science initiative, and they also pair that with other detection methods including some sticky traps that are around the city.
When we wanted to see data showing where the actual PSHB was detected, we ran into a brick wall. There appear to be no publicly available datasets or maps of the extent of this pest in Western Australia. We turned to the Atlas of Living Australia (ALA) and found all of 16 records of the species, all just north of Brisbane.
Indeed, it turns out that this data is under wraps at DPIRD. There are Non Disclosure Agreements being offered to Local Government Authorities (LGAs) to access the information on where this pest species occurs, and that’s quoted as being standard practice to “protect the privacy of individual residents whose trees have been infested”. There is a significant amount of concern around this lack of data being made available from the LGAs, who do a lot of the actual pest control. From what we understand, the data that is being offered to LGAs to do the work is limited to heat maps that use census blocks for resolution - pretty much useless if you’re looking for a particular tree to monitor, treat (our real hope, which is being trialled in the City of Canning) or remove. It’s also quite the opposite approach that other places are taking (like the City of Cape Town who makes all their data available).
So, we were stuck - we don’t have any public way to identify where the pest is, so we turned to the hosts. DPIRD have publicly put out a list of tree species that are susceptible to PHSB attack, which means we can start to do something about identifying where these trees are, so we can start to think about where the potential spread might be.
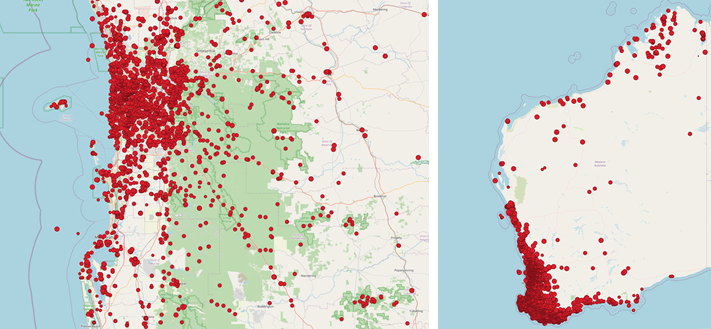
And it looks potentially like this:
At a high level, this map was generated by taking all of the species in the listing, and then getting the data from the ALA from those species to throw onto the map. In a more detailed manner, Kehan went into a deep dive last night, grabbed the list from DPIRD, used a Jupyter Notebook in Google Colab (available if you want to play with it) to pull the list out of the PDF format file, fetch the records from the ALA using their Galah package (using the Python version), and throw the maps together that are in this blog out of the resultant GeoJSON file.
The map only shows the presence of these host tree species if they have been recorded in the ALA, and it is by no means complete or without error (such as those showing up in the water). It also doesn’t take into account areas that have been cleared already, so those trees might not be there. This sort of host detection could also be done through satellite and aerial imagery, although you’d need a really high resolution dataset (like WorldView, Planet, Nearmap or Metromap). There’s even options - although many are yet to be proven - that machine learning tools (Artificial Intelligence or AI) could also help with the detection of those hosts - maybe even crawling Google Street View imagery to identify species of trees.
But still, that’s not bad for a quick overnight investigation into the whole issue - our team are always keen to investigate environmental issues and see what we can do to help solve them.
If we could identify all the host trees in the State, you could also look at doing a proximity analysis - if we knew where the pest itself was - because then you could look at any potential host trees that are within a 400m distance of an infestation (the maximum that a PHSB female can fly to the next host). You could also look at treatment (again, our best hope) across areas in a ‘firebreak’ style approach - noting that there is the natural firebreak in the north of the state of 80 mile beach (which is also a potential barrier for another invasive species coming south - the cane toad), as well as the Nullarbor to the south. But that only works if someone doesn’t pack up some infested firewood into the back of a truck and cross those breaks.
In any case; the PSHB is apparently here to stay in WA. Our agricultural industry (valued at $15.5 billion in 2022) is gearing up for a fight, and organisations like ours stand ready to assist. If you’re interested, get in touch with us via email, or our social media channels, Facebook, LinkedIn or Instagram.
Piers
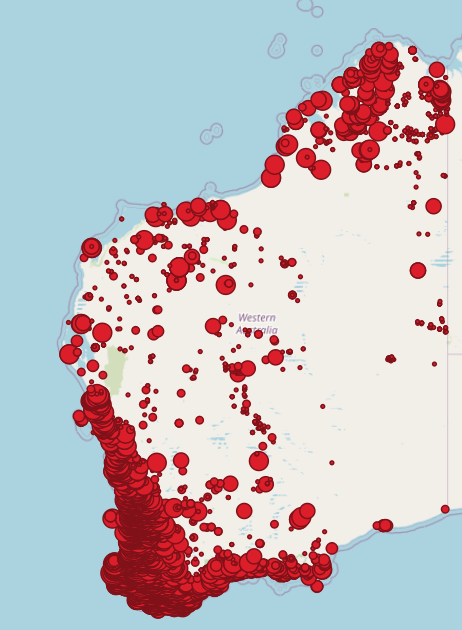
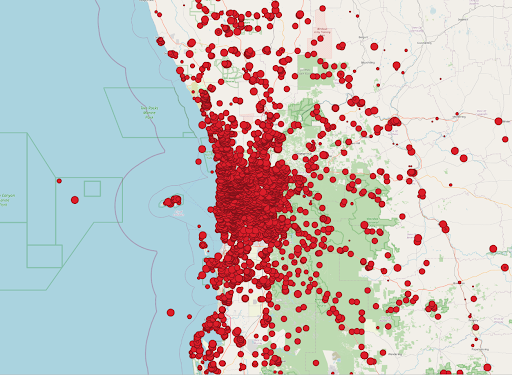
Late edit: If you take out the "low" rated susceptible species, the patterns and data shows a bit of a different pattern for the State and for the Perth region, but also still shows the data issues (like a lack of records away from roads) inherent in the data, as shown below.