Lately we’ve been focusing a lot as a company on creating positive customer experiences. We’ve always been a company with values around “doing the right thing by the client” and “delivering what we said we would”, but recently we’ve also renewed our focus on keeping their “end game” and outcomes in clear view as well as keeping good communication lines open throughout. All this means that that expectations, changing priorities and unforeseen circumstances can be managed in a collaborative and cooperative environment.
Too often projects can finish and be considered ‘delivered’ but as a consultant how do we know if we have done something useful in the client’s eyes? And when you think of the ‘client’ there are actually several different perspectives involved. This got us thinking about how we can be sure that we can deliver even more value to our clients.
To start, Andrew and I considered the quantitative and qualitative measures one could look at. Quantitative measures could include:
- Time efficiency: units of time saved per day * number of impacted staff * salary cost = Efficiency savings (e.g. time to spend on other productive work like finding the next ore body or more environmental activity)
- Financial risk reduction: key decision X was more informed because of the delivered solution and therefore resulted in avoiding Y dollars in penalties or legal obligations.
- Operational Cost Reduction: removing duplicate software licencing, or moving to more cost effective approaches for delivering systems and software.
Qualitative measures could include:
- Process efficiency and self service: Staff saying the new system or process is a better way of doing things and therefore is more efficient for their day-to-day workloads.
- Information discovery: the difficult one to quantify around finding things they didn’t know existed, or finding things with less effort than before
- Collaboration: using the developed system to communicate and share ideas
- Better experience: increased trust in the information delivered through the solution as opposed to fishing it out from numerous sources.
When you look across both qualitative and quantitative measure, this is all about “benefits realisation” (in project management speak), and it can take a considerable amount of time to properly reflect on the impact of a new system; but really, beauty is in the eye of the beholder – so we thought we would reflect this through the lens of two recent (and heavily intertwined) projects with Independence Group NL.
These two recent projects were the broad Spatial Data Management project, and the quite focussed work we did on the Disturbance and Rehabilitation Tracking project. We’ve blogged on our work with them several times in the recent past, as well (which you can find in those two links), but for a quick recap; the Spatial Data Management project was all about transforming and improving their ongoing approach to data management, reducing and removing inefficiences and improving accuracy. The Disturbance and Rehabilitation Tracking project had us review environmental Regulations across Australia, and deliver a prototype system for comprehensively and efficiently managing their ground disturbance and rehabilitation tracking.
 Field teams out on IGO tenements – Image courtesy of Independence Group NL.
We thought we’d start with the qualitative measures and so we’ve gathered some perspectives (i.e. we’ve paraphrased a lot of feedback) from the staff within IGO to give us a good starting point for our evaluation:
- Environment Manager: The dashboards and work you’ve done on disturbance data look great, and my colleagues are starting to see how it will build confidence in the information we collect and increase the accuracy of environmental data for Mine Rehabilitation Fund (MRF) reporting and Annual Environmental Reports (AER).
- Resource Manager: I’ve seen good data management practices put in place elsewhere and I know it works, and we are starting to see those benefits after making a good start – people just need to get used to using these products so they can tell us what other problems they want us to help solve.
- GIS Coordinator: We are really happy with the way we can centrally manage our data, and then easily push mapping layers and statistics out to staff on QGIS and Qliksense dashboards.
- Heritage Manager: I can finally see all of the heritage work done on our tenements in one place, and no longer have to look around for it. I am now actively updating this layer and telling everyone to use it themselves.
- Project Geologist: QGIS opens so much quicker than what I am used to, and it’s great having these standard layers and templates ready to go for my next project.
- Exploration Geologist: If we can get simplified tracks and drillpad data coming through automatically from the field, that will save me a lot of time over what I currently do.
- Senior Executive: Excellent work guys – looking good!
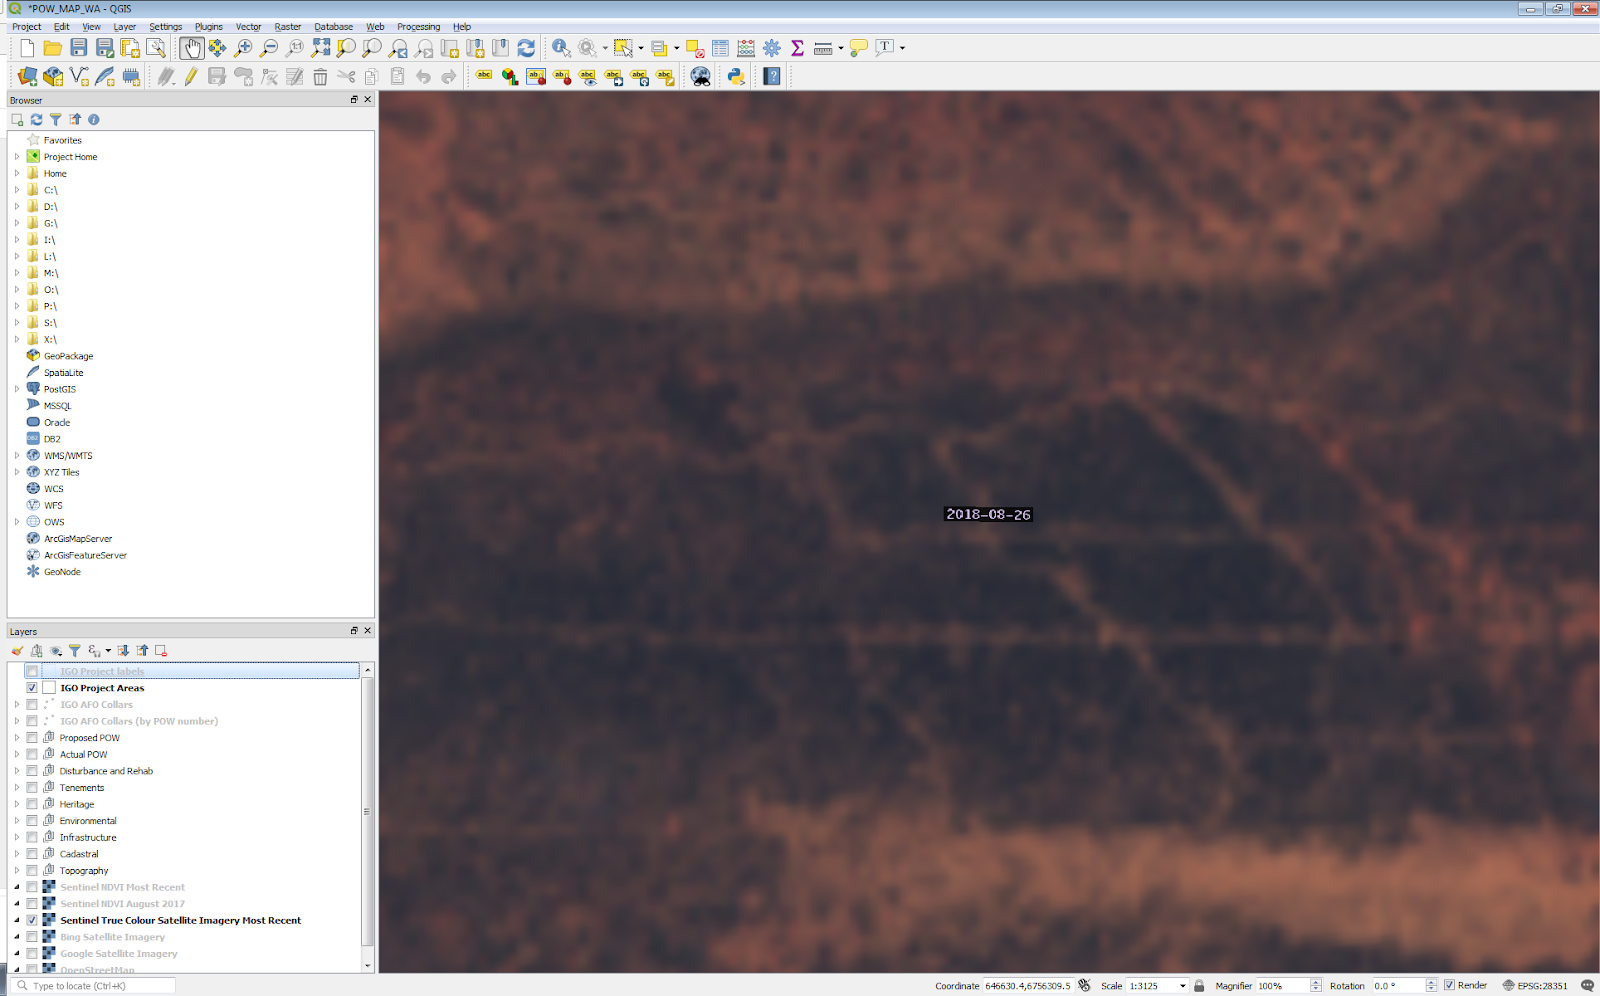
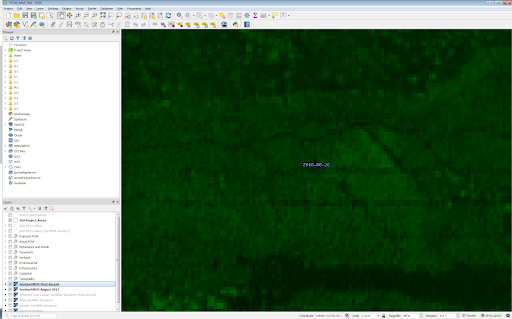
Using QGIS with Sentinel imagery (with its 5 day refresh frequency) is proving to be a good way of monitoring track and drilling disturbance. Sentinel true colour image (left) and NDVI for the same area (right).
Going back to our approach, this actually ticks all the boxes for us – process efficiency and self service, information discovery, collaboration, and better experience. The qualitative and quantitative measures can be summarised:
Time efficiency:
- Project Geologist – saving 2 minutes per GIS project loading, and 2-3 seconds faster on each map pan or zoom
- Exploration Geologist – saving of 1 day per field shift in capturing clearing tracks
- Heritage Manager – savings of hours per week in sourcing survey information relevant to active projects
- GIS Coordinator – savings of hours per week in publishing consistent corporate data and enabling staff self-service discovery
Risk reduction:
- A single heritage layer means all staff are aware of heritage assets and can plan each project around them
Operational cost reduction:
- Replacing a number of desktop GIS software licences and replacing them with open source QGIS (which also performs faster as above),
- Removing the need for some desktop GIS licences all together, replacing them with Qliksense spatial views.

Qliksense dashboard for ground disturbance with search bar and quantitative (!) statistics calculated by tenement and Program of Work permits.
It is still early days to look at all of the benefits – as we said, some won’t be fully realised for quite some time – but we are encouraged by the feedback we’ve been getting so far, and this has been a great win for the client, and our team are really proud of the work we’ve done.
For IGO, this means that they are even better poised to deliver on their environmental and other obligations, and we look at that as a big win for us in terms of our goal of supporting organisations that work with the environment.
This all started at IGO with one of our small “GIS Health Check” projects, where we do some digging around into how the spatial side of a business is organised. Here at Gaia Resources we always try to provide holistic solutions that deliver real business benefits (it’s one of our core values) rather than just ticking a ‘project completed’ box. That means we work with our clients to go beyond what is written in the project brief and try and find the underlying business problems they are trying to solve – and solving those is a key success factor for our work.
If you have problems that your organisation is trying to solve feel free to reach out and start a conversation with either Andrew or myself. We can contacted by email, or feel free to kick off a chat with us via Facebook, Twitter or LinkedIn.
Chris
Comments are closed.