New versions of the Prawn Watch app for Apple and Android mobile devices have been recently released.
Prawn Watch is a citizen science project run by the Swan River Trust’s River Guardians program aimed at increasing the community’s understanding of prawns in Western Australia’s Swan and Canning rivers. The Prawn Watch app allows the prawning community to simply record and upload catch data to a River Guardians database. This information will then be assessed by the researchers and the results will contribute to the long-term sustainable conservation aims of the project.
What’s New in Version 1.0.3
We have upgraded the site information form so that when making a new observation you can record depth as a decimal number (rather than whole metres). Also, the specific catch method you are using can be selected from a drop-down box.
The ‘My Records’ map screen will now show the four Prawn Watch zones: Zone 1 – Upper Swan Estuary; Zone 2 – Middle Swan Estuary; Zone 3 – Lower Swan Estuary; and Zone 4 – Canning Estuary.
They will be coloured to indicate the total number of prawns that have been recorded in that zone since the beginning of the current prawning season (1st November each year). This ‘heat-map’ represents the total number of prawns in 5 bands on a logarithmic scale: orange 0-9; blue 10-99; yellow 100-999; red 1000-9999; and purple >10000 records.
Each time you visit this screen the app will refresh the data from the server to display the latest heat-map of total prawn counts for the current season. Any submitted observations you have previously made are also represented on the map by a purple prawn icon; if you click on the prawn icon, you can see the date and time that you made the observation.
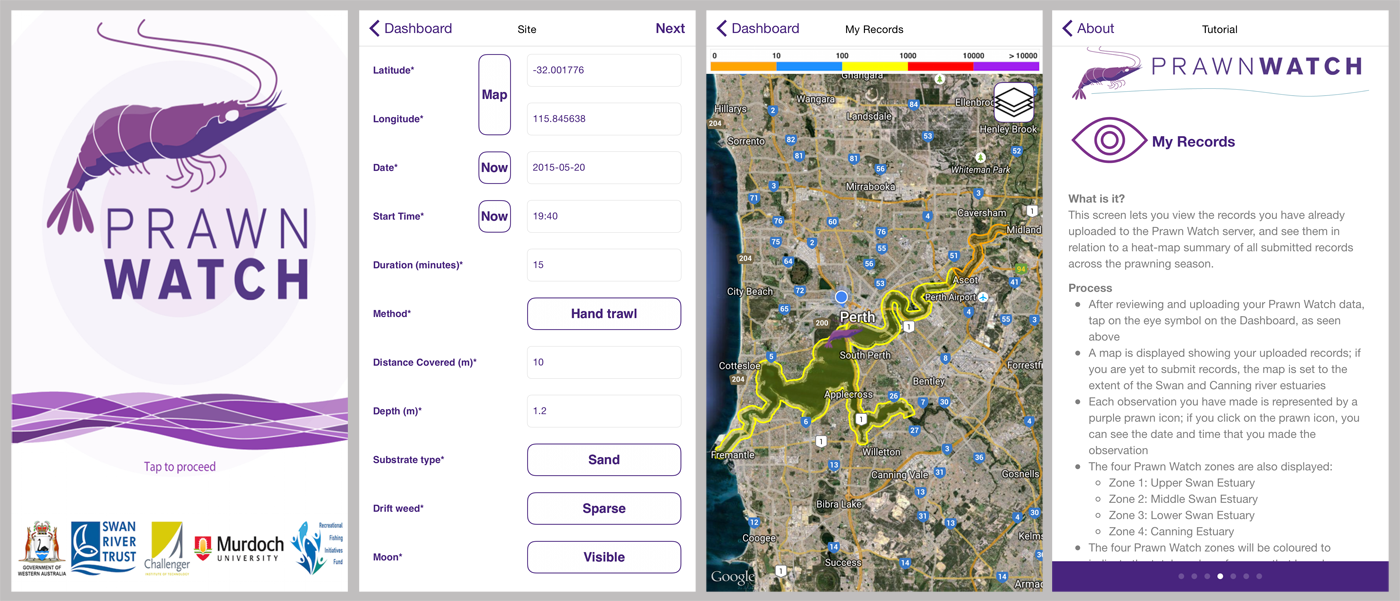
Screenshots from the Mobile app
This season’s data submissions can be viewed on our interactive map. For more information check out the original launch post, contact me via email, or drop us a line on Facebook or Twitter.
Alex
Comments are closed.