In recent weeks we’ve all seen the news regarding South Australia’s (SA) disastrous Karenia mikimotoi algal bloom (link, link, link), which is estimated to be twice the size of the Australia Capital Territory (ACT) and has washed up more than 14,000 dead animals along its shores.
At Gaia Resources we are passionate about the environment and using technology to make a positive impact. As such this got us wondering what is the cause of this situation and how might we use technology to assist the situation - or to better understand its impacts.
After all, this situation is not unique to SA. The SA coastline is “particularly vulnerable to algal blooms due to coastal nutrient inputs, warming shallow waters and poor water exchange," says Professor Ivan Nagelkerken from the University of Adelaide Environment Institute. Learning from this situation doesn’t just help SA, but also Australia and the world as a whole.
The cause of this algal bloom is also corroborated by the SA government, who note that:
- SA has experienced a “marine heatwave” since September 2024 (with water about 2.5°C warmer than normal),
- Floodwaters from the River Murray in 2022–23 brought extra nutrients into the sea, and
- A cold-water upwelling in summer 2023–24 lifted more nutrients to the surface.
So this got us thinking about what we could do with technology and publicly available resources to better understand this phenomenon. Also, we wondered what insights technology can give us on how this algal bloom may progress in the coming weeks and months. Equipped with this question and our specialist skills in environmental science, data science, and visualisation we started some investigations and based on what we found we are hopeful we have some positive news for the future. But let’s start with how we got here:
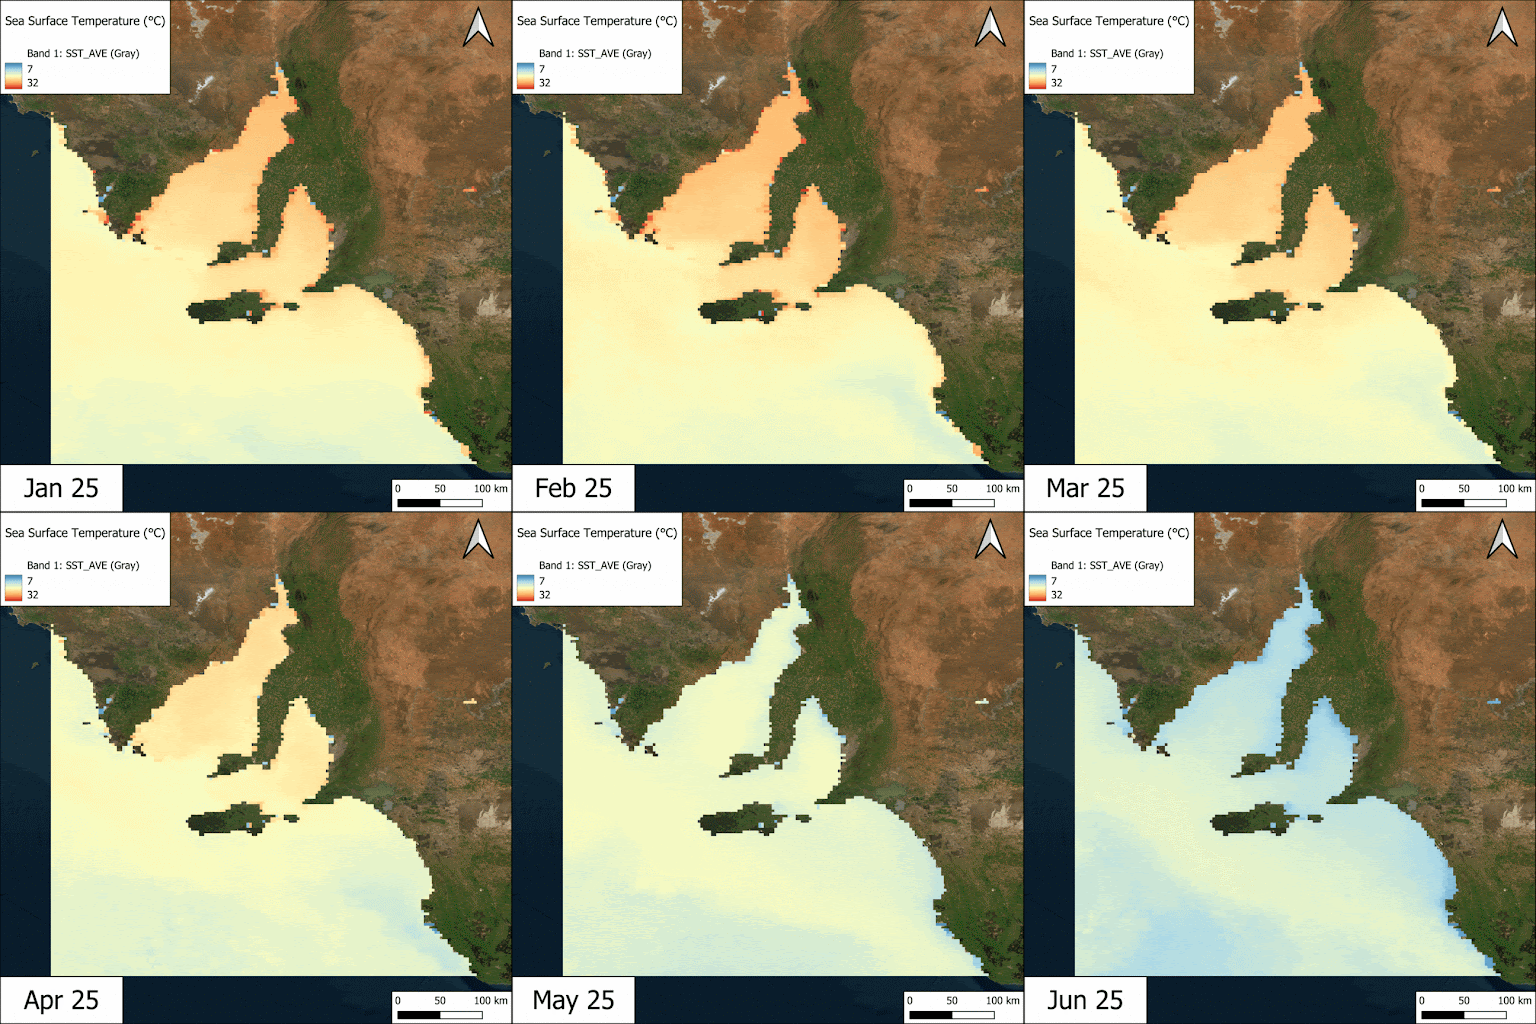
Using open source satellite imagery data from JAXA (the Japan Aerospace Exploration Agency) we were able to obtain the mean day time sea surface temperature (in 5 km resolutions) around the Adelaide area and came out with the following results:

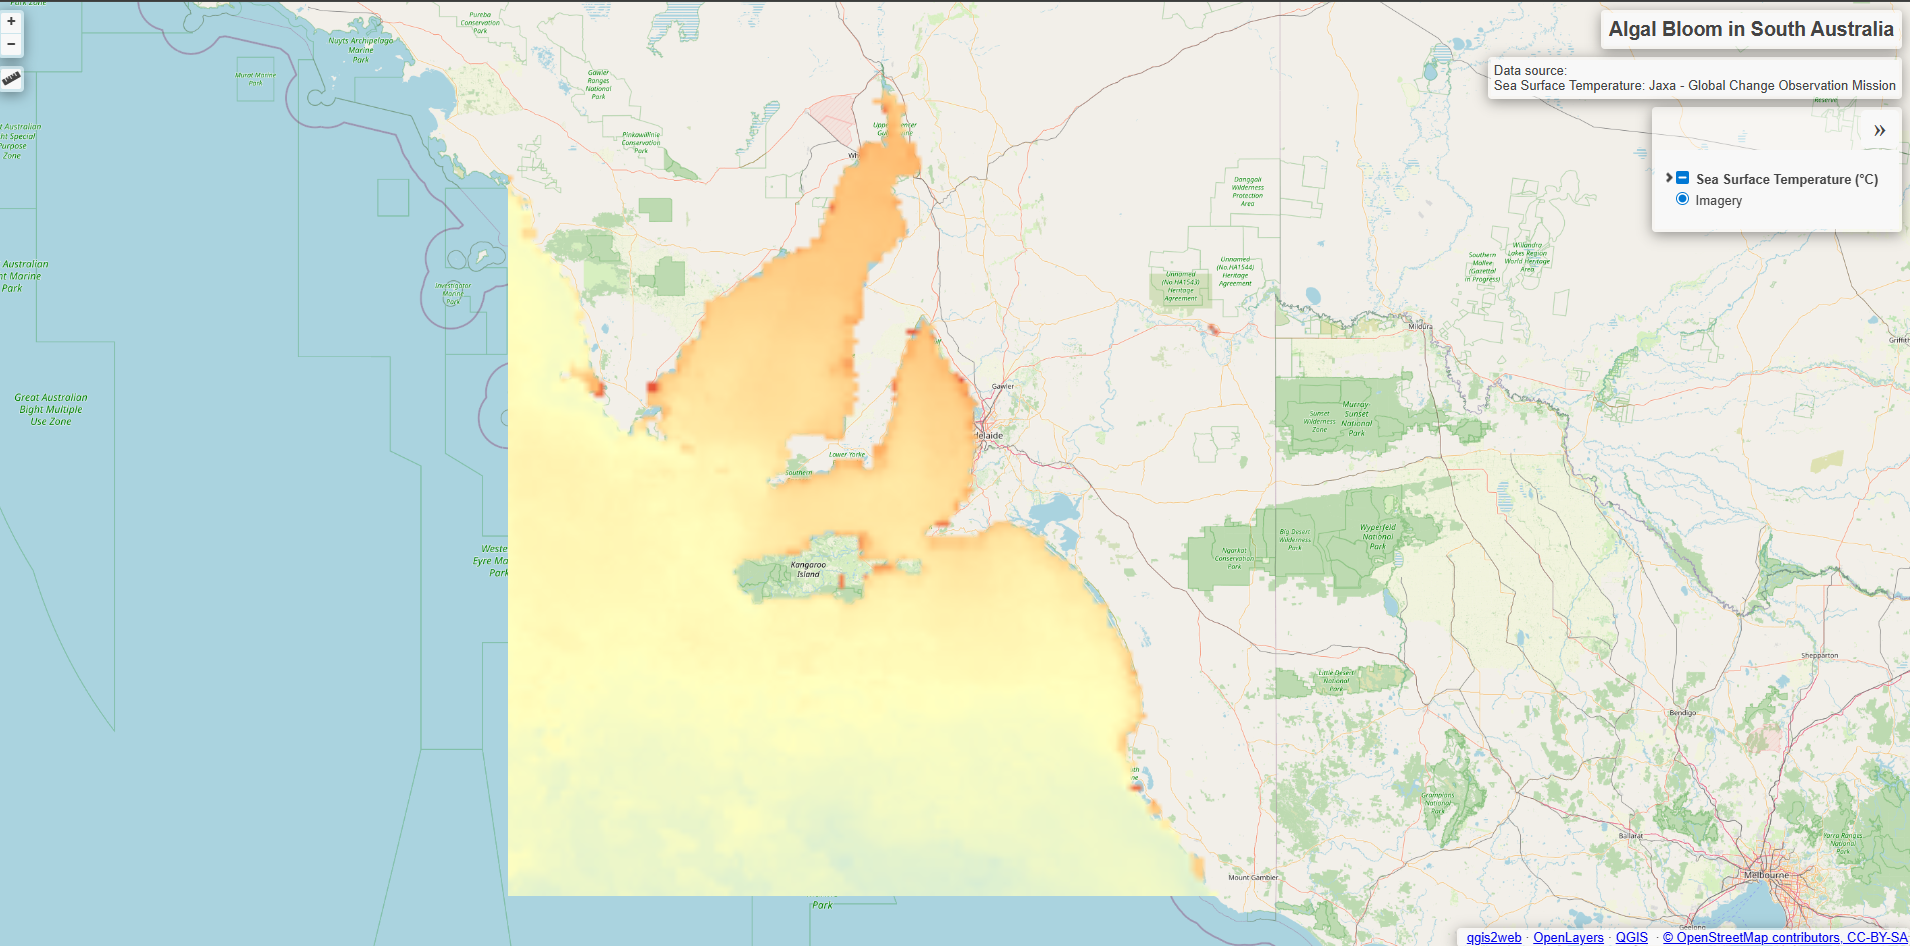
Or, if the animation isn’t to your liking, here’s a link to an interactive map we created to demonstrate the changes over recent months in sea surface temperatures

These images show that there are clearly some raised sea surface temperatures in the first months of 2025. As some of those other links we used earlier indicate, this was likely coupled with a nutrient influx to the oceans that has caused the algal bloom.
Inverting this scenario gives us some guidance on what we might need to see in order to be hopeful of some respite. Increased rain and wind over the area to break up the bloom? Good news. Reduced surface temperatures over the ocean? Good news too.
Where we think we are starting to see some of this positive news is in the later months of May and June where we are seeing dips in average temperature (try turning on the May and June images in the interactive map). It is still very early days to see any impact from these changes in environmental values (plus seasonal increased average windspeeds and peaks in rainfall may also help break up the algal bloom). We are hopeful that there is some positive news from what has been a disastrous few months for sea life, people, and the economy.
It also got us thinking about whether using temperature data, along with average rainfall data for May, and maybe even some machine learning, we may be able to build a prediction system for the onset of algal blooms in Australia. This could potentially also work for tracking the dissipation of blooms that are currently underway. This approach could provide some increased confidence in measuring these sadly increasingly common situations around Australia and the world.
We are hopeful that this sort of thinking could be factored into the $28 million support package announced by the state and federal governments. Particularly with $8.5 million being set aside for early detection and water testing (including a planned new $2 million algae testing lab in SA adding increased sovereignty and speed with no longer needing to send samples overseas for testing).
We love working at the intersection of technology and the environment, and this quick project was a great opportunity to bring these worlds together. If you have a project in this space and want to discuss how we can use these skills to help please reach out to Piers or myself to discuss at enquiries@gaiaresources.com.au or via our social media channels, Facebook, LinkedIn or Instagram
Jarrad
Other Resources:
- South Australian Harmful Algal Bloom - Water Sampling Dashboard
- Support for business and industry impacted by algal bloom grants
- Karenia mikimotoi at the Atlas of Living Australia